Inventory Planning: Forecast Consumption Visibility
In MYOB Acumatica, the forecasted demand is included in inventory planning workflows. Forecasts can be set up based on historical sales data, seasonality, or other business-specific patterns and can be adjusted for various factors, such as promotions or anticipated demand spikes. These forecasts provide insight that managers can use to determine replenishment strategies so that inventory levels are optimized to avoid stockouts or overstock. As such, the forecasts help companies to maintain balance in inventory-carrying costs and to meet customer demand efficiently.
When a forecast is marked as dependent, MYOB Acumatica automatically reduces the forecasted quantity by the quantity of items in sales orders and excludes the consumed forecasted quantity from inventory planning. By using dependent forecasts, companies can reduce the risk of over-ordering and producing excess inventory that may not be needed.
Previous versions of MYOB Acumatica did not provide the ability to easily compare the forecasted demand with the actual demand for dependent forecasts, so planning managers had to create custom reports or generic inquiries. In MYOB Acumatica 2025.1.1, a side panel has been introduced on the Forecast (AM202000) and Forecast Listing (AM000005) forms to improve the visibility of the actual demand during particular forecast intervals. The tabs of the new side panel of this form are described in the following section.
Side Panel on the Forecast and Forecast Listing Forms
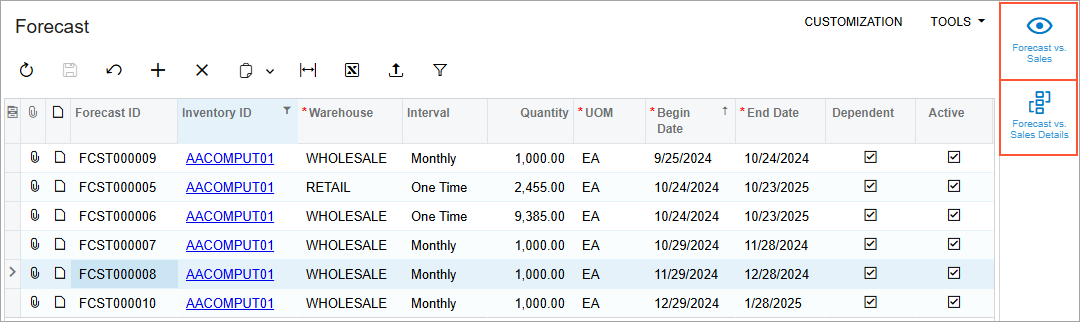
A side panel has been added to the Forecast (AM202000) and Forecast Listing (AM000005) forms with the Forecast vs. Sales and Forecast vs. Sales Details tabs. The following screenshot shows these tabs on the side panel of the Forecast form. On these tabs, the system displays data from the Forecast vs. Sales (AM404100) and Forecast vs. Sales Details (AM404200) inquiry forms, respectively. These inquiry forms have been added to the site map and are available in the Inventory Planning workspace.
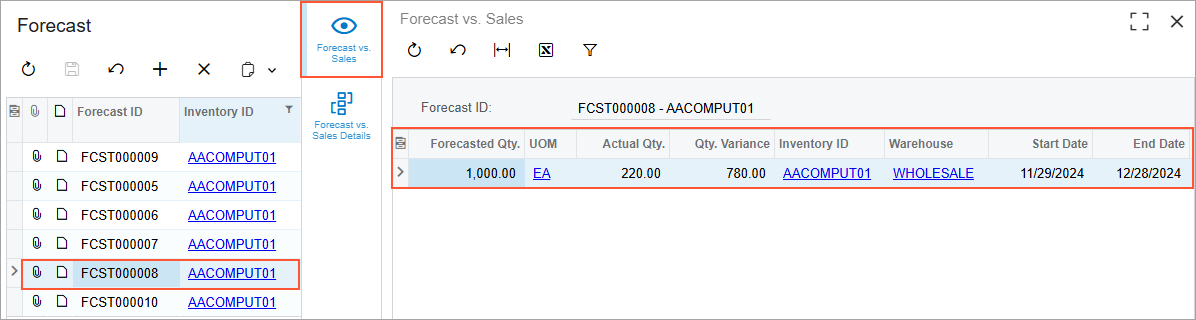
For each forecast selected on the Forecast or Forecast Listing form, a planning manager can open and expand the Forecast vs. Sales tab to see the forecasted quantity, the ordered quantity, and the quantity variance for each forecast interval. (See the following screenshot.)
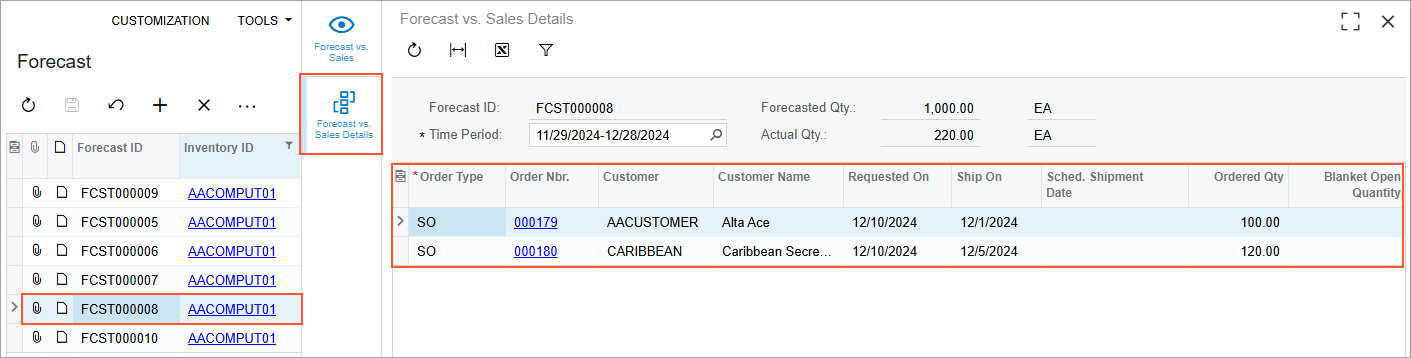
To explore which sales orders consumed the forecasted demand, the planning manager can use the Forecast vs. Sales Details tab, which is shown in the following screenshot. The table on this tab lists all sales orders that have been created for the item during the forecast interval selected in the Selection area, along with the ordered quantities and additional details from the corresponding sales order lines.