
Manufacturing: Enhanced Production Scheduling Views
In MYOB Acumatica 2025.1.1, production scheduling views have been significantly enhanced. The improvements address the diverse needs of different manufacturing environments, providing manufacturing schedulers and planners with advanced tools to visualize and manage production schedules more effectively.
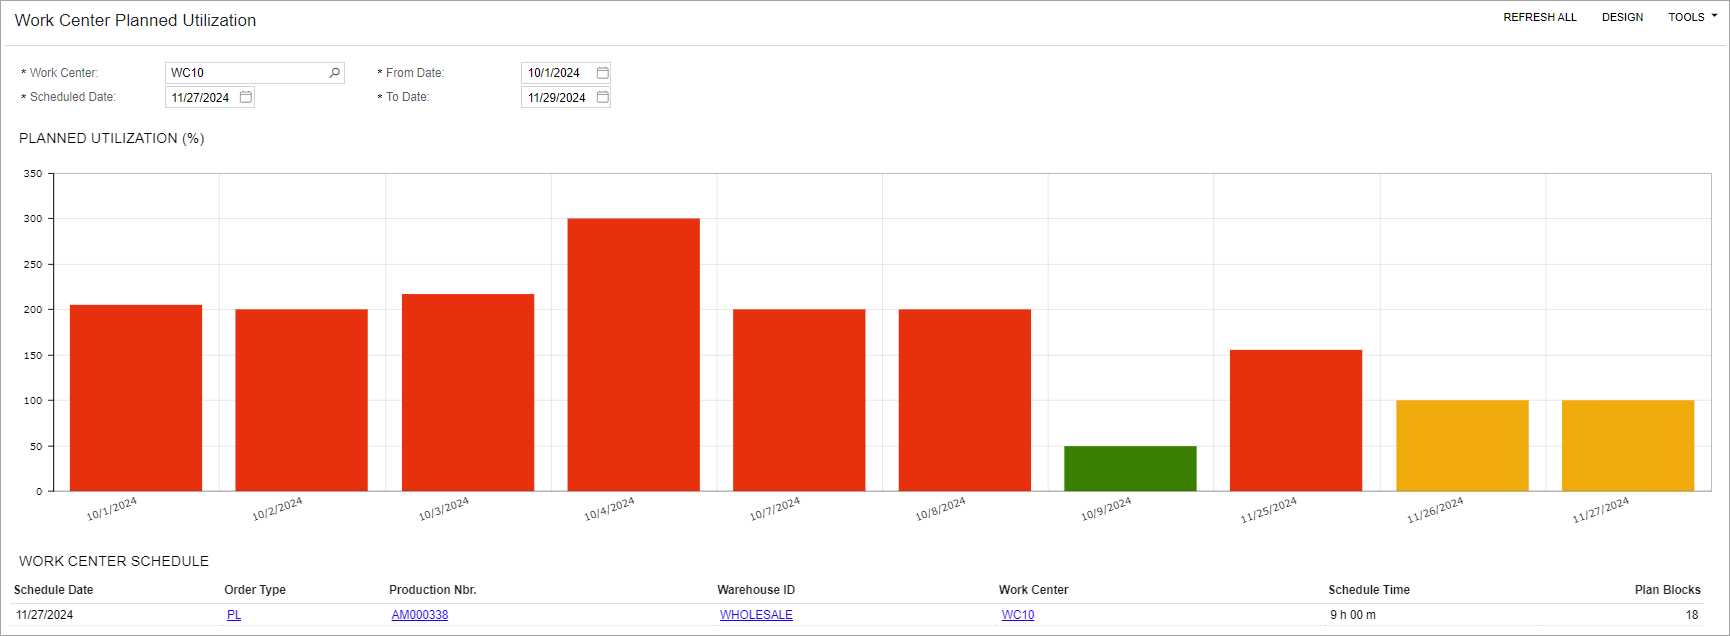
Work Center Planned Utilization Dashboard
A new dashboard, Work Center Planned Utilization (AM0044DB), has been introduced. This dashboard offers a graphical view of the planned load for a work center, displayed as a bar graph representing utilization over time. Users can select specific work centers to analyze and define time ranges for the data displayed on the graph. The planned load is shown as a percentage of capacity. The graph uses the following color coding to represent planned load:
- Green: Planned load is between 0% and 100%.
- Yellow: Planned load is greater than or equal to 100% and less than 101%.
- Orange: Planned load is greater than or equal to 101% and less than 120%.
- Red: Planned load is greater than or equal to 120%.
The Work Center Schedule table below the graph displays information about the production schedule and load details for the date selected in the Schedule Date box.
The dashboard is shown in the following screenshot.
In the out-of-the-box system, a user can find the link to this dashboard in the Dashboards workspace under the Dashboard: Manufacturing category.
The dashboard is available only if the Advanced Planning and Scheduling feature is enabled on the Enable/Disable Features (CS100000) form.