Tailoring the Customer Portal: To Create and Design a Dashboard
In the following implementation activity, you will configure a dashboard in the MYOB Acumatica Customer Portal.
Story
Suppose that you are Kimberly Gibbs, system administrator who also handles dashboards at the SweetLife Fruits & Jams company. You need to create the new Case Activities dashboard based on a request from a SweetLife customer, the Storehut chain of supermarkets in New York. On the dashboard, the customer's managers should be able to monitor cases reported to SweetLife and have quick access to orders.
Configuration Overview
For the purposes of this activity, the following tasks have been performed:
- The MYOB Acumatica application instance with the U100_SSP_Admin_2025.1 dataset preloaded and the Customer Portal application instance have been deployed in the same database.Tip:This deployment is outside of the scope of this training.
- In the U100_SSP_Admin_2025.1 dataset, on the User Roles (SM201005) form of MYOB Acumatica, the Portal Admin role has been assigned to the gibbs user account. The user account is associated with Kimberly Gibbs, the system administrator in the SweetLife Fruits & Jams company. The role provides full administrative privileges in the Customer Portal.
Process Overview
In this activity, you will do the following:
- Create the Case Activities dashboard
- Set up user access rights to the dashboard
- Add the Data Table, Link, and KPI widgets to the dashboard
- Select the dashboard layout template
- Verify that the dashboard has been correctly configured
System Preparation
Before you start creating and designing a dashboard in the Customer Portal, do the following:
- Sign in to MYOB Acumatica as system administrator Kimberly Gibbs by using the gibbs username and the 123 password.
- On the Enable/Disable Features (CS100000) form, make sure
that the following features have been enabled:
- Customer Portal
- B2B Ordering
- Case Management on Portal
- Financials on Portal
- Make sure that you have performed the following prerequisite activities:
- Configuring the Customer Portal: To License the Customer Portal Instance
- Configuring the Customer Portal: To Specify the General Settings of the Customer Portal
- Managing Access to the Customer Portal: To Create User Roles for a Customer’s Employees
- Managing Access to the Customer Portal: To Create User Types for User Accounts
- Managing Access to the Customer Portal: To Create User Accounts for Contacts
- Managing the Inventory Catalog in the Customer Portal: Implementation Activity
- Configuring Case Management in the Customer Portal: Implementation Activity
- Tailoring the Customer Portal: To Create a Generic Inquiry
- Launch the Customer Portal website with the U100_SSP_Admin_2025.1 dataset preloaded.
- Sign in to the system as system administrator by using the gibbs username and the 123 password.
Step 1: Creating a Dashboard
To create the Case Activities dashboard, do the following:
- In the Customer Portal, open the Dashboards (SM208600) form.
- In the Summary area, do the following:
- In the Name box, type Case Activities.
- In the Owner Role box, select Portal Admin.
- Clear the Allow Users to Personalize check box. Portal users should not be given the ability to make personalized copies of the dashboard.
- On the form toolbar, click the Publish to the UI button. The Publish to the UI dialog box opens.
- In the dialog box, specify the following settings:
- Site Map Title: Case Activities
- Workspace: Support
- Category: Dashboards
- In the Access Rights section of the dialog box, select the Copy Access Rights from Screen option button. Make sure that Dashboards is selected in the box right of the option button.
- Click Publish to complete the publication process.
You have created an empty dashboard. In the next step, you will set up access rights for users to this dashboard.
Step 2: Setting Up User Access Rights for an Administrator to the Dashboard
Now you need to change the access rights to the dashboard so that users with the Portal Admin role can add widgets to the dashboard and users with Customer Admin and Customer User roles can view the dashboard.
While you are still viewing the Case Activities dashboard on the Dashboards (SM208600) form in the Customer Portal, do the following:
- On the Visible To tab, in the row that has Portal
Admin in the Role column, make sure that the
Granted option is selected in the Access
Rights column.Tip:You can type the name of the role into the Search box in the lower part of the tab to quickly find the role.
With these access rights, the gibbs user can view the dashboard because Portal Admin is the owner role you specified for the dashboard.
- In the row that has Customer Admin in the Role column, select Granted in the Access Rights column.
- On the form toolbar, click Save.
- In the row that has Customer User in the Role column, select Granted in the Access Rights column.
- On the form toolbar, click Save.
- On the form toolbar, click View. The Case Activities dashboard opens. The dashboard is empty because you have not yet added any widgets to it.
- On the dashboard title bar, make sure that the Design button is displayed. This indicates that the user can modify the dashboard.
You have set up access rights for the Customer Portal administrator and users and verified that you have correctly set up the access rights for the administrator. Now you can populate the dashboard with widgets, which you will do in the next steps of this activity.
Step 3: Adding a Data Table Widget to the Dashboard
To add a Data Table widget to the dashboard in the Customer Portal, do the following:
- While you are still viewing the Case Activities dashboard, on the dashboard title bar, click the Design button to switch to design mode.
- In the widget placeholder in the upper part of the screen, click Add a new widget. The Add Widget dialog box opens.
- In the Add Widget dialog box, click Data Table.
- Click Next.
- In the Inquiry Screen box of the Widget Properties dialog box, which opens, click the magnifier button. The lookup table opens.
- In the Search box, type cases.
- In the Title column, double-click Open Cases, which closes the lookup table and fills in the Inquiry Screen box of the dialog box.
- Click Inquiry Parameters.
- In the Inquiry Parameters dialog box, which opens, do the
following:
- Clear the Me check box.
- Click OK.
- In the Widget Properties dialog box (which you return to after closing the Inquiry Parameters dialog box), select the Automatically Adjust Height check box.
- Click Column Settings.
- In the Column Settings dialog box, which opens, move
columns from the Selected Columns list to the
Available Columns list by selecting each needed
column and then clicking the arrow pointing left. The Selected
Columns list should contain only the following columns:
- Subject
- Status
- Reason
- Severity
- Priority
- Contact
- Click OK. The Column Settings dialog box is closed.
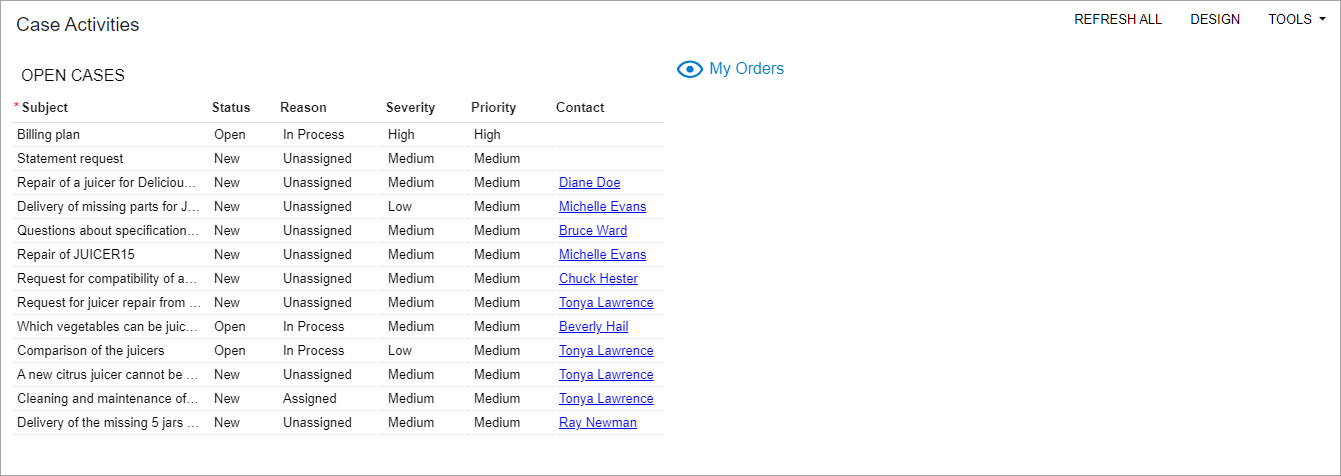
- In the Caption box of the Widget Properties dialog box (to which you return), type open cases to specify the title of the widget.
- Click Finish to create the widget with the settings you have specified, save it, and add it to the dashboard.
- On the dashboard title bar, click the Design button to switch to view mode.
Step 4: Adding a Link Widget to the Dashboard
To add a Link widget to the dashboard in the Customer Portal, do the following:
- While you are still viewing the Case Activities dashboard, on the dashboard title bar, click the Design button to switch to design mode.
- In the widget placeholder in the right part of the screen, click Add a new widget. The Add Widget dialog box opens.
- In the dialog box, click Link.
- Click Next.
- In the Widget Properties dialog box, which opens, do the
following:
- In the Icon box, select the visibility
icon, which will be displayed in the widget.Tip:You can begin typing the name of the icon into the box to quickly find the icon.
- In the Form box, do the following:
- Click the magnifier button.
- In the lookup table that opens, in the Search box, type orders.
- In the Title column, double-click My Orders, which closes the lookup table and fills in the Form box of the dialog box.
- In the Caption box, type My Orders.
- Click Finish to save your changes and close the
dialog box.
The widget is added to the workspace.
- In the Icon box, select the visibility
icon, which will be displayed in the widget.
- On the dashboard title bar, click the Design button to switch to view mode.
You can see the Case Activities dashboard with the Open Cases and My Orders widgets in the following screenshot.

Step 5: Adding a KPI Widget of the Meter Visualization Type to the Dashboard
In this step, in the Customer Portal, you will create a Key Performance Indicator (KPI) widget based on the All Cases generic inquiry. This widget will display the total number of cases and their level in the number of cases. To add the KPI widget to the dashboard, do the following:
- While you are still viewing the Case Activities dashboard, on the dashboard title bar, click the Design button to switch to design mode.
- In the widget placeholder in any part of the screen, click Add a new widget. The Add Widget dialog box opens.
- In the dialog box, click Key Performance Indicator (KPI).
- Click Next.
- In the Widget Properties dialog box, which opens, do the
following:
- In the Inquiry Screen box, select the All Cases inquiry, which will be used as a base for the widget.
- In the Field to Aggregate box, select Case ID.
- In the Aggregate Function box, make sure the Count All is selected.
- In the Normal Level Type box, leave the default Fixed Value.
- In the Normal Level box, specify 10.
- In the Alarm Level Type box, select Percent Value.
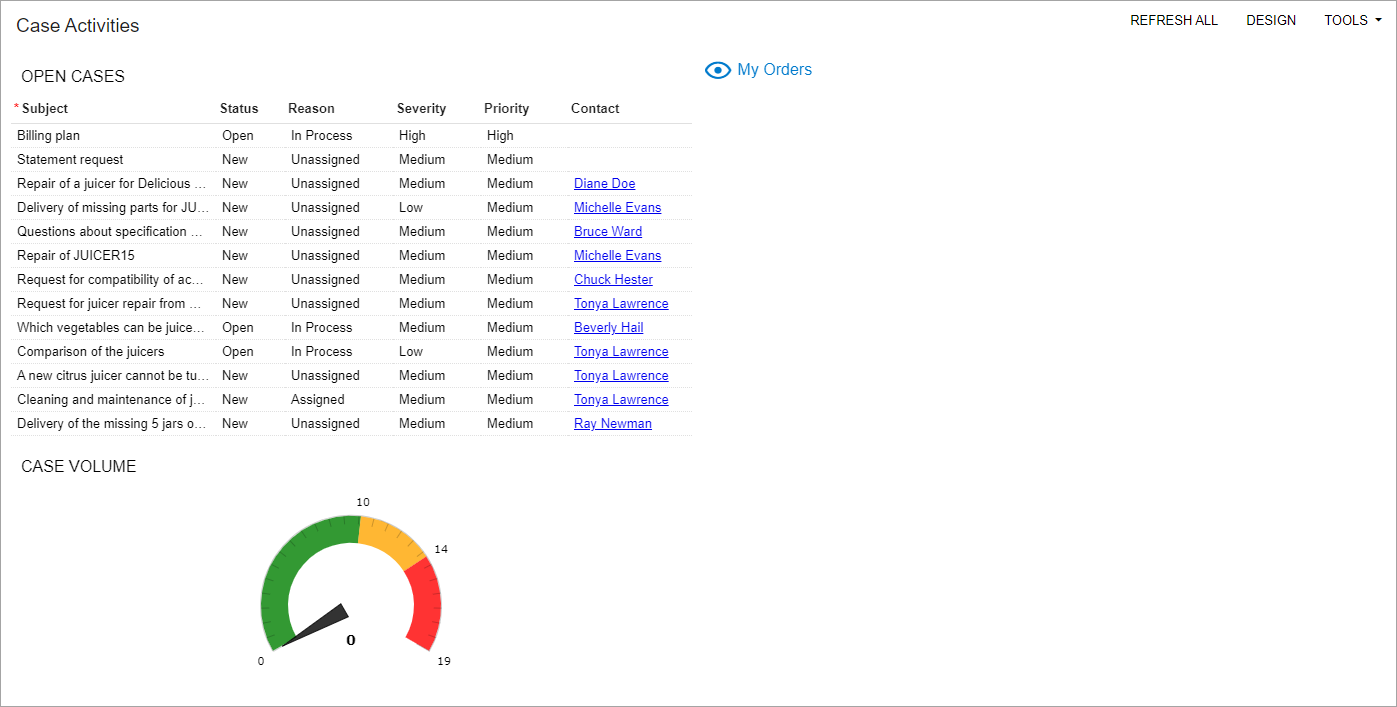
- In the Alarm Level box, specify 140. We specify 150% to revert the levels. 10 cases will be a normal level, from 11 to approximately 15 cases will be a warning level, and from 16 to 20 cases will be an alarm level.
- Define the colors as follows:
- Normal Color: Green
- Warning Color: Orange
- Alarm Color: Red
- In the Visualization Type box, select Meter.
- In the Caption box, type case volume.
- Click Finish to save your changes and close the
dialog box.
The widget is added to the workspace.
- On the dashboard title bar, click the Design button to switch to view mode.
You can see the Case Activities dashboard with the Case Volume widget in the following screenshot.

Step 6: Adding KPI Widgets of the Scorecard Visualization Type to the Dashboard
In this step, in the Customer Portal, you will create two Key Performance Indicator (KPI) widgets based on the All Cases generic inquiry.
You will create the Case Volume widget and change the parameters of new widgets. To add KPI widgets to the dashboard, do the following:
- While you are still viewing the Case Activities dashboard, on the dashboard title bar, click the Design button to switch to design mode.
- Point at the Case Volume widget and on the widget title bar, click the Clipboard button to copy the settings of the widget.
- In the widget placeholder in any part of the screen, click Paste from clipboard. The system inserts the copied widget.
- On the title bar of the created widget, click the Edit button. The Widget Properties dialog box opens.
- Click the Filter Settings button.
- In the Filter Settings dialog box, which opens, do the
following:
- On the table toolbar, click Add Row.
- In the Data Field column of the added row, select Status.
- In the Conditions column leave the default value: Equals.
- In the Value 1 column, select New.
- On the table toolbar, click Add Row.
- In the Data Field column of the added row, select Reason.
- In the Conditions column leave the default value: Equals.
- In the Value 1 column, select Unassigned.
- Click OK to save your changes.
- In the Normal Level box, specify 2.
- In the Visualization Type box, select Scorecard.
- In the Icon box, select access time.
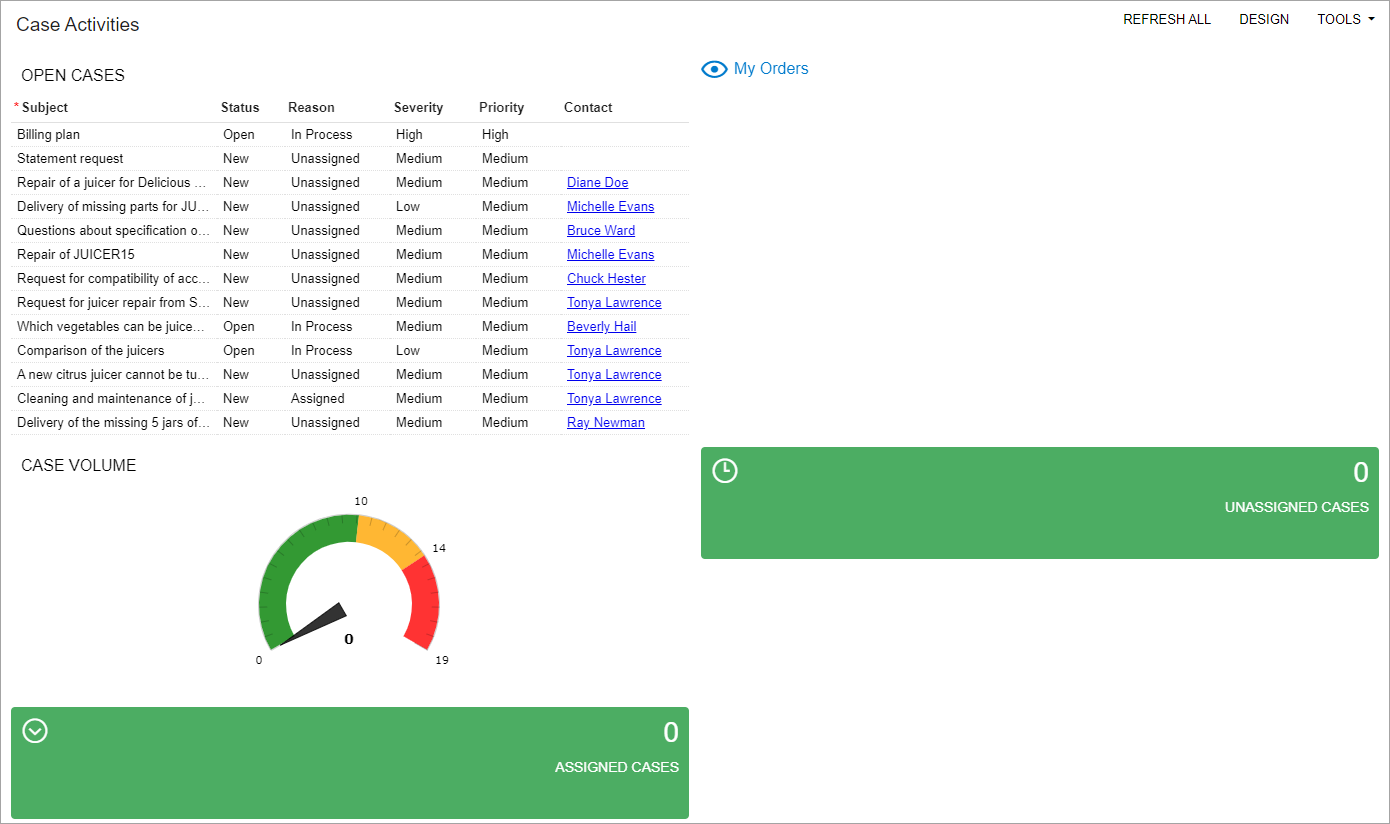
- In the Caption box, type unassigned cases.
- Click Finish to save your changes and close the dialog
box.
The widget is added to the dashboard.
- Point at the Unassigned Cases widget and on the widget title bar, click the Clipboard button to copy the settings of the widget.
- In the widget placeholder in any part of the screen, click Paste from clipboard. The system inserts the copied widget to the dashboard.
- On the title bar of the created widget, click the Edit button. The Widget Properties dialog box opens.
- Click the Filter Settings button.
- In the Filter Settings dialog box, which opens, do the
following:
- In the row with Reason, change Value 1 column, select Assigned.
- Click OK to save your changes.
- In the Icon box, select arrow drop down circle.
- In the Caption box, type assigned cases.
- Click Finish to save your changes and close the dialog
box.
The widget is added to the dashboard.
- On the dashboard title bar, click the Design button to switch to view mode.
You can see the dashboard with the KPI widgets in the following screenshot.

Step 7: Selecting a Template for the Dashboard Layout
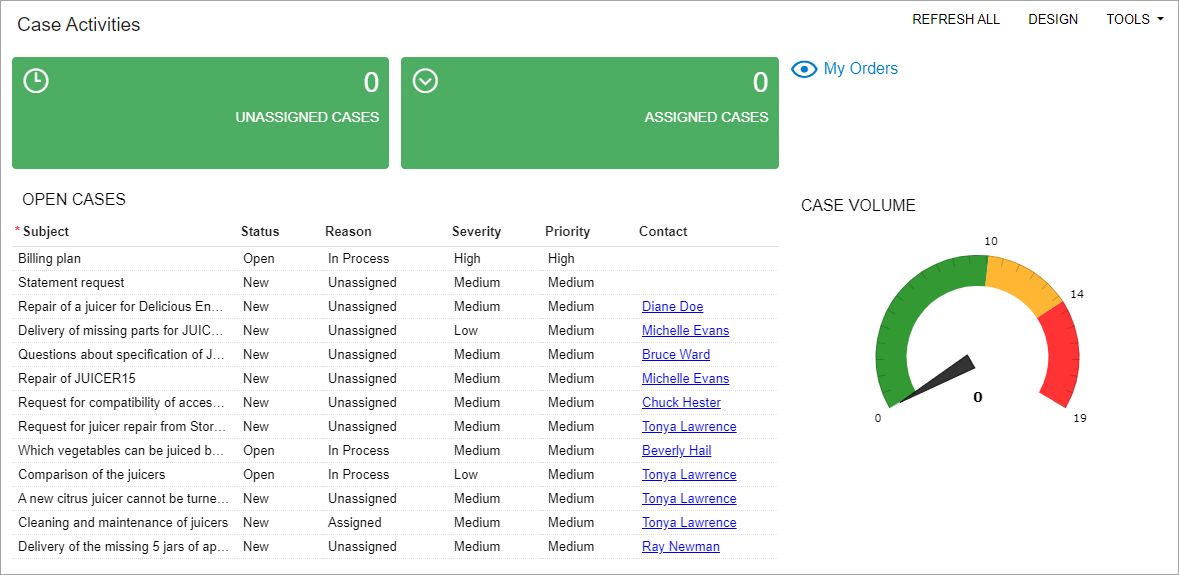
Suppose that you want to arrange the widgets on the dashboard so that the left column takes two-thirds of the width of the working area. With this layout, the Open Cases widget on the dashboard will be larger and easier to see and the My Orders widget will be smaller. Further suppose that you want to place the Unassigned Cases and Assigned Cases widgets above the Open Cases widget and the Case Volume widget under the My Orders widget.
To select a dashboard layout template, do the following:
- While you are still viewing the Case Activities dashboard in view mode, click the Design button on the dashboard title bar to switch to design mode.
- On the dashboard title bar, click the Edit Layout button.
- In the Dashboard Layouts dialog box, which opens, do the
following:
- Select the layout template that has a wide left column (two-thirds of the working area) and a narrow right column (one-third of the working area).
- Click OK. The dialog box is closed, and the dashboard widgets are arranged within the selected layout.
- Drag the My Orders widget to the right.
- Drag the right border of the Open Cases widget to the right so that the
widget takes two-thirds of the working area.Tip:If the content of each widget's column is not fully displayed, you can drag the right border of the needed column.
- Make your dashboard look similar to the dashboard in the screenshot below.
Rearrange the widgets on the dashboard as follows:
- Open Cases under Unassigned Cases and Assigned Cases
- Case Volume under My Orders
Tip:You can drag and drop all the widgets on the dashboard as you need. Widgets are resizable, and you can change their size as well by dragging a widget by its corner. - On the dashboard title bar, click the Design button to
switch to view mode.
You can see the dashboard with the new layout in the following screenshot.
Figure 4. The new layout of the Case Activities dashboard 
- Sign out of the Customer Portal.
Step 8: Verifying That the Dashboard Has Been Correctly Configured
To make sure that portal users can use the newly created Case Activities dashboard in the Customer Portal and that it has been configured correctly, do the following:
- Sign in to the Customer Portal as the customer's contact Tonya Lawrence by using the tonya@storehut.example.com username and the 123 password.
- On the main menu panel, click Support to open the Support workspace.
- In the Dashboards category, click Case Activities to open the dashboard.
- Make sure that the Open Cases and My Orders widgets, which you
have added to the dashboard in the previous steps, are correctly displayed on
the dashboard, as shown in the following screenshot.
Figure 5. The Case Activities dashboard (viewed by a portal user) 
- Sign out of the Customer Portal.
