- Contents
- Index
- Search

Display results with all search words
Design Tab - Standard Components Toolbar

The tools on the Standard Components toolbar are mostly for adding display components to the report, e.g. headings, labels or company logos. To add a standard component to a report, click the button for the component you want to add, then click on the report canvas in the place where you want the component to be. Components can be moved and re-sized after you have added them, and right-click options are available to set advanced properties.
|
Button |
Name |
Description |
|
|
Select |
When this tool is enabled, you can select components on the report canvas. This tool is enabled by default - whenever you use another tool to place a component, after the component is placed, the Select tool becomes enabled again. |
|
|
Label |
Adds a text label to the report. You can double-click on a Label component to edit the text in it directly, or select it use the Edit toolbar, which becomes a text box where you can enter the label's caption. You can change the appearance of the label using the controls on the Format toolbar. |
|
|
Memo |
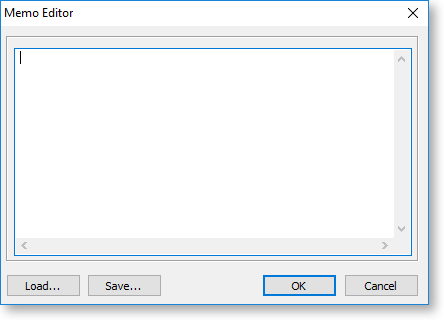
Adds a block of text to the report. You can double-click on a Memo component to edit the text in it directly, or you can right-click on the component and select Lines to open the Memo Editor, where you can enter text, load text from a .TXT file, or save the text as a .TXT for re-use.
|
|
|
Rich Text |
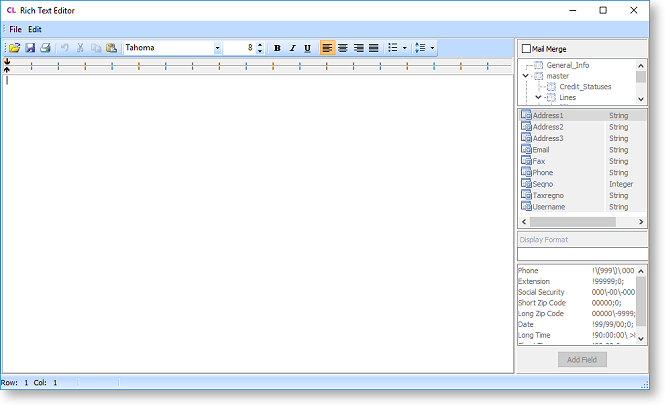
Adds a block of formatted text to the report. To edit the text, right-click on the component and select Edit to open the Rich Text Editor, where you can enter and format text. You can also load text from a .RTF file, or save it for re-use. This window also has a Mail Merge section that lets you set up a mail merge in a report.
|
|
|
System Variable |
Adds a system variable like the page number, page count, print date and time, or current date and time to the report. When a system variable is selected, the Edit toolbar becomes dropdown where you can select the variable to display. |
|
|
Variable |
Adds a variable for use in calculations on the report - these can be used in calculations on the Calc tab. You can right-click on a variable and select Calculations to open the Calculations Window and set up calculations for the variable directly. |
|
|
Image |
Adds a graphic to the report. Right-click on the component and select Picture to choose the graphic file to display. |
|
|
Shape |
Adds a simple shape, e.g. a rectangle or ellipse to the report. When a shape is selected, the Edit toolbar becomes a dropdown where you can select the kind of shape. You can change the shape's appearance using the controls on the Draw toolbar. |
|
|
Line |
Adds a straight line to the report. When a shape is selected, the Edit toolbar becomes a dropdown where you can select the line's orientation. You can change the line's colour and width using the controls on the Draw toolbar. |
|
|
Chart |
Adds a chart to the report. |
|
|
BarCode |
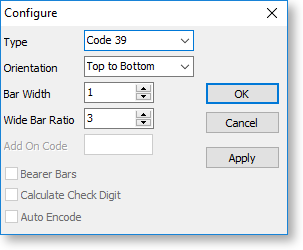
Adds a barcode to the report. When a barcode is selected, the Edit toolbar becomes a text box where you can enter the text that should be encoded in the barcode. Right-click on the component and select Configure to opens a window where you can select the barcode standard to use and set display options.
|
|
|
Checkbox |
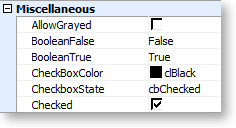
Adds a checkbox graphic to the report. You can set the checkbox to appear checked, unchecked or greyed out by editing its by editing its Checked or CheckboxState properties on the Report Tree. (The greyed out state can only be selected if the AllowedGrayed property is ticked.)
|
|
|
RotatedLabel |
Adds a rotated text label to the report. Note: This component has been superseded - you can edit the angle of a regular Label component by right-clicking on it and selecting Position. |
|
|
TotalVariable |
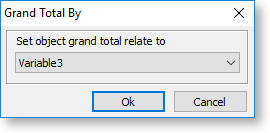
Adds a component that totals the values of a selected variable. When a total variable component is selected, the Edit toolbar becomes a dropdown where you can select the variable's data type. Right-click on the component and select Grand Total to open a window where you can select the variable that will be totalled:
|
|
|
2DBarCode |
Adds a two-dimensional barcode to the report. 2D barcodes, also known as QR Codes, can contain more data than a linear barcode. When a 2D barcode is selected, the Edit toolbar becomes a text box where you can enter the text that should be encoded in the barcode. |
|
|
HTML Text |
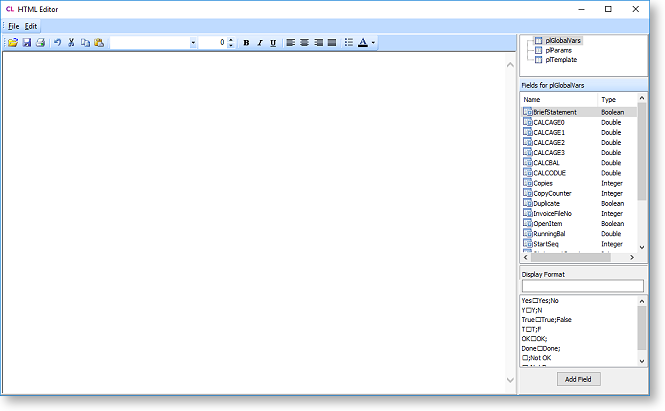
Adds a block of HTML code to the report, which can be used as a template for HTML mail merges. To edit the text, right-click on the component and select Edit HTML to open the HTML Editor, where you can enter and format text. Report variables are available on the right of the window - you can add a variable to the text by double-clicking on it or by selecting it and clicking Add Field. You can also load text from a .HTML file, or save it for re-use.
Add a hyperlink by selecting text, right-clicking and selecting Edit hyperlink. Add an image by right-clicking and selecting Insert image. Note: Image source files are assumed to be in the Exo Business shared images folder, as specified by the Folder location for images profile setting. |
|
|
GradientPanel |
Adds a rectangular panel containing a linear gradient to the report. Note: This component has been superseded - you can add a gradient to any Shape component using the controls on the Draw toolbar. |