- Contents
- Index
- Search

Display results with all search words
Design Tab - Data Components Toolbar
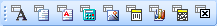
The tools on the Data Components toolbar are similar to those on the Standard Components toolbar; however the components that these tools are data aware, that is, they are bound to a field from the database, and display the value of this field at runtime. When any data component is selected, the Edit toolbar contains two dropdowns, which allow you to specify the table and field that the component is bound to:
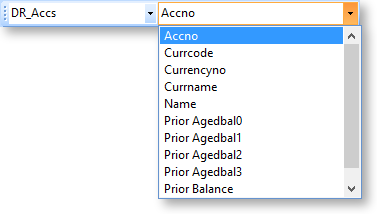
The first dropdown contains all data sources that appear in the Data Tree - this includes any data sources set up on the Data Tab, as well as other data sources that are built into the report, such as global variables and user-created report parameters. The second dropdown contains the fields or parameters available for the selected data source.
To add a standard component to a report, click the button for the component you want to add, then click on the report canvas in the place where you want the component to be. Components can be moved and re-sized after you have added them, and right-click options are available to set advanced properties.
|
Button |
Name |
Description |
|
|
DBText |
Adds a single-line plain text component to the report, which can handle most data types, but cannot display rich text or images. |
|
|
DBMemo |
Adds a multi-line plain text component to the report, which can display plain text from the memo field of a database table. |
|
|
DBRichText |
Adds a multi-line rich text component to the report, which can display formatted text from the memo field of a database table. |
|
|
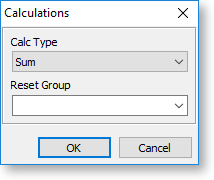
DBCalc |
Adds a field that performs simple database calculations (Count, Sum, Min, Max, Average). When a DBCalc components is first placed on a report it displays "Sum(?)". Use the Edit toolbar to choose the field that the calculation will be performed on. To perform a calculation other than "Sum", right-click on the component and select Calculations to open a window where you can select the type of calculation:
|
|
|
DBImage |
Adds a graphic that is stored in a database field. |
|
|
DBBarCode |
Adds a barcode to the report, which encodes data from a database field. Right-click on the component and select Configure to opens a window where you can select the barcode standard to use and set display options. |
|
|
DBChart |
Displays a chart based on one or more data series from the defined data sources. |
|
|
DB2DBarCode |
Adds a two-dimensional barcode to the report, which encodes data from a database field. 2D barcodes can contain more data than a linear barcode. |
|
|
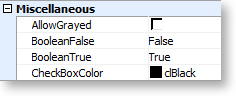
DBCheckBox |
Adds a checkbox graphic, whose status is taken from a Boolean value in the database. Select the field whose value determines the checkbox's status from the Edit toolbar, then enter the values that signify "checked" or "not checked" into the BooleanTrue and BooleanFalse properties under Miscellaneous on the Report Tree. By default, these are set to "True" and "False" but depending on the contents of database field they may need to be "T" and "F", "Y" and "N", "1" and "0", or some other combination.
|