- Contents
- Index
- Search

Display results with all search words
The Data Tree
The Data Tree displays the data sources that have been set up for the report, and lets you create data-aware report components by dragging fields onto the editing canvas. The Data Tree has two tabs: Data and Layout.
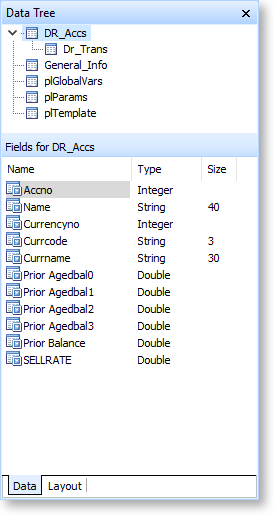
Data Tab
The Data Tree section shows all available data sources for the report, including any data sources set up on the Data Tab, as well as other data sources that are built into the report, such as global variables and user-created report parameters. Selecting an item on this section displays all available fields, variables or parameters for that item in the Fields section below.
Drag one or more items from the Fields section onto the report canvas to add components to the report (you can select multiple items with the CTRL or SHIFT key). Depending on the options selected on the Layout tab, one or both of the following components will be created for each item:
- A label component, displaying caption text.
- A DBText component bound to the item that you dragged onto the canvas.
Layout Tab
The Layout tab defines the components that are created when data items are dragged onto the canvas and how they are laid out.
Choose from the following options:
- All - create a label component and a data component for each item.
- Labels - create label components only.
- Fields - create field components only.
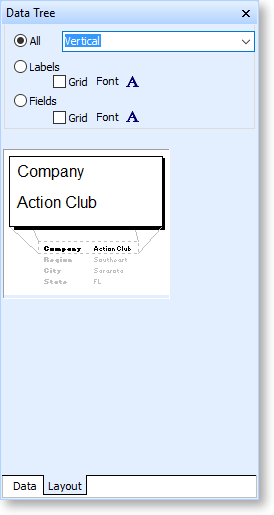
When "All" is selected, you can choose between a Vertical and Tabular layout.
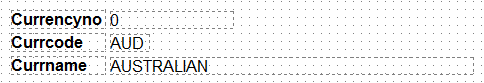
In a vertical layout, label/data component pairs are arranged vertically, with each pair on one line:
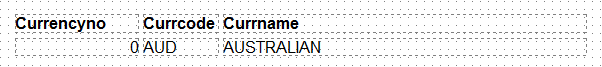
In a tabular layout, component pairs are arranged horizontally with each pair in one column:
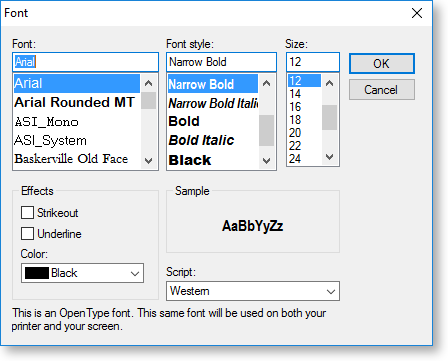
The Layout tab also contains Grid and Font controls for labels and fields. Tick the Grid boxes to display grid outlines around label and/or field components. Click the Font buttons to set up font options for label and field components: