
System Health: General Information
You use the System Monitor (SM201530) form for monitoring the current operational data and statistics of MYOB Acumatica, as well as for investigating any potential or existing performance issues.
If MYOB Acumatica is used on the premises of your company or in your own data center, you can evaluate the limitations of the environment in which the system is operating with the data that is shown on this form.
Learning Objectives
In this chapter, you will learn how to do the following:
- Monitor processes that are currently running, and discover and analyze any threads that are currently frozen or no longer responding
- Review the list of active users
- Track memory and CPU utilization
- Analyze a log of system events
- Create a memory dump
- Monitor the statuses of push notifications and business event queues
- Use the Request Profiler (SM205070) form
- Use the Developer Tools of the browser
Applicable Scenarios
You monitor system health in the following cases:
- Monitoring system health is a part of your regular duties.
- Users of the system have reported that MYOB Acumatica performance has been slow.
- Users of the system have reported that some tasks in MYOB Acumatica have failed to complete. For example, scheduled operations have failed, or at least one record has not been processed successfully.
Monitoring of Running Processes
On the Running Processes tab of the System Monitor (SM201530) form, you can monitor all batch processing operations that are currently being performed in the system, such as the release of multiple transactions at once, the preparation of dunning letters, the generation of a report, the creation of a tenant snapshot, or the use of an import or export scenario. Your server may be slow because of a large number of these operations running simultaneously.
By default, the table displays only the processes of the current user. To view the processes run by all users, you select the Show All Users check box above the table.
You can navigate to the form where a user has launched a process by selecting the process in the table and clicking View Screen on the table toolbar. The system navigates to the form, where you can stop the operation or review any errors that have occurred. For details on mass processing, see Processing Pop-Up Window.
On the Running Processes tab, you can abort any process that is running by clicking the row with the process and clicking Abort on the table toolbar.
For long operations, MYOB Acumatica runs threads. You can discover and analyze the threads that are currently frozen or no longer responding by clicking Active Threads on the table toolbar and viewing details in the pop-up panel. If there is at least one active thread, the panel contains information about the currently running threads.
Review of the List of Active Users
You use the Active Users tab of the System Monitor (SM201530) form to review the list of currently active users. In the Login Type box, you can filter users by the way they have accessed the system. By default, All is selected, so the system lists users who have signed in by using either of the available methods. You can instead select one of the following:
- User Interface: The table lists only users that have signed in by using their username and password on the MYOB Acumatica Sign-In page, through the mobile application, or through the single sign-on page if SSO with Google or Microsoft Account has been set up.
- API: The table lists only users that are client applications that have signed in by using the OAuth 2.0 mechanism of authorization for applications, or by using the sign-in method of the contract-based SOAP API, contract-based REST API, or screen-based SOAP API.
If you click a row with a user in the list and click View User on the table toolbar, the system navigates to the Users (SM201010) form so that you can view information about the selected user.
Tracking of Resource Usage
You use the Resource Usage tab of the System Monitor (SM201530) form to monitor how an MYOB Acumatica instance is using memory and CPU in the application server where the instance is installed.
At the bottom of the form, you can view charts that illustrate the current CPU and memory usage of the application server by the MYOB Acumatica instance. You can switch off the Java script that automatically updates the charts by modifying the value for the EnableResourceUsageAutoUpdate key in the web.config file.
Analysis of the System Event Log
You use the System Events tab of the System Monitor (SM201530) form to analyze the log of system events. The tab lists log records for multiple system events. You can explore the log for errors, warnings, or operations that consume excessive resources. For details, see System Health: System Event Log.
Creation of a Memory Dump
You use the Running Processes tab of the System Monitor (SM201530) form to start the process of creating a memory dump. Upon successful creation, the memory dump is saved on the server that runs your MYOB Acumatica instance. For details, see System Health: To Create a Memory Dump.
Monitoring of System Queues
You use the System Queue Monitor (SM302010) form to monitor the statuses of the push notification, business event, and commerce queues. By using this form, you can clear the queues and restart dispatchers for the selected type of queue. On this form, you can also turn on notifications about the growth of the system queue, which are sent when a threshold is reached. These notifications can be sent by email, via SMS messages, or through mobile push notifications.
Use of the Request Profiler Form
The Request Profiler (SM205070) form is an embedded tool that you can use to troubleshoot performance-related issues in MYOB Acumatica or an MYOB Acumatica Framework-based application. For details, see System Health: Request Profiler.
Use of the Developer Tools
Each browser has a set of web development and debugging tools called Developer Tools. You can use these browser Developer Tools to see all performance metrics of a request-response cycle. For details, see System Health: To Monitor Performance.
Submission of Performance Logs to MYOB
In MYOB Acumatica, you can enable the collection of the diagnostic information and the submission of it to MYOB by selecting the Send Diagnostics & Usage Data to MYOB check box on the Site Preferences (SM200505) form. With the check box selected, the diagnostic information is collected and sent to MYOB. The collected data is used to improve the customer experience, as well as to enhance the products and services of MYOB. This data transmission takes place in the background without affecting current tasks or the performance of MYOB Acumatica instance.
Also, for licensed instances where the collection of diagnostic information is enabled, a user who is experiencing a performance issue can make the system collect more detailed information about the last ten actions.
This user opens the MYOB Trace page by clicking on the title bar of the form on which the issue is occurring. On the toolbar of the page, the user clicks Submit Logs (see Item 1 in the following screenshot). The system collects messages, SQL requests, and exceptions for the user's last ten actions and marks this collection with a unique tag. The system sends the information to MYOB and displays the tag to the user so that the user can save it (Item 2).
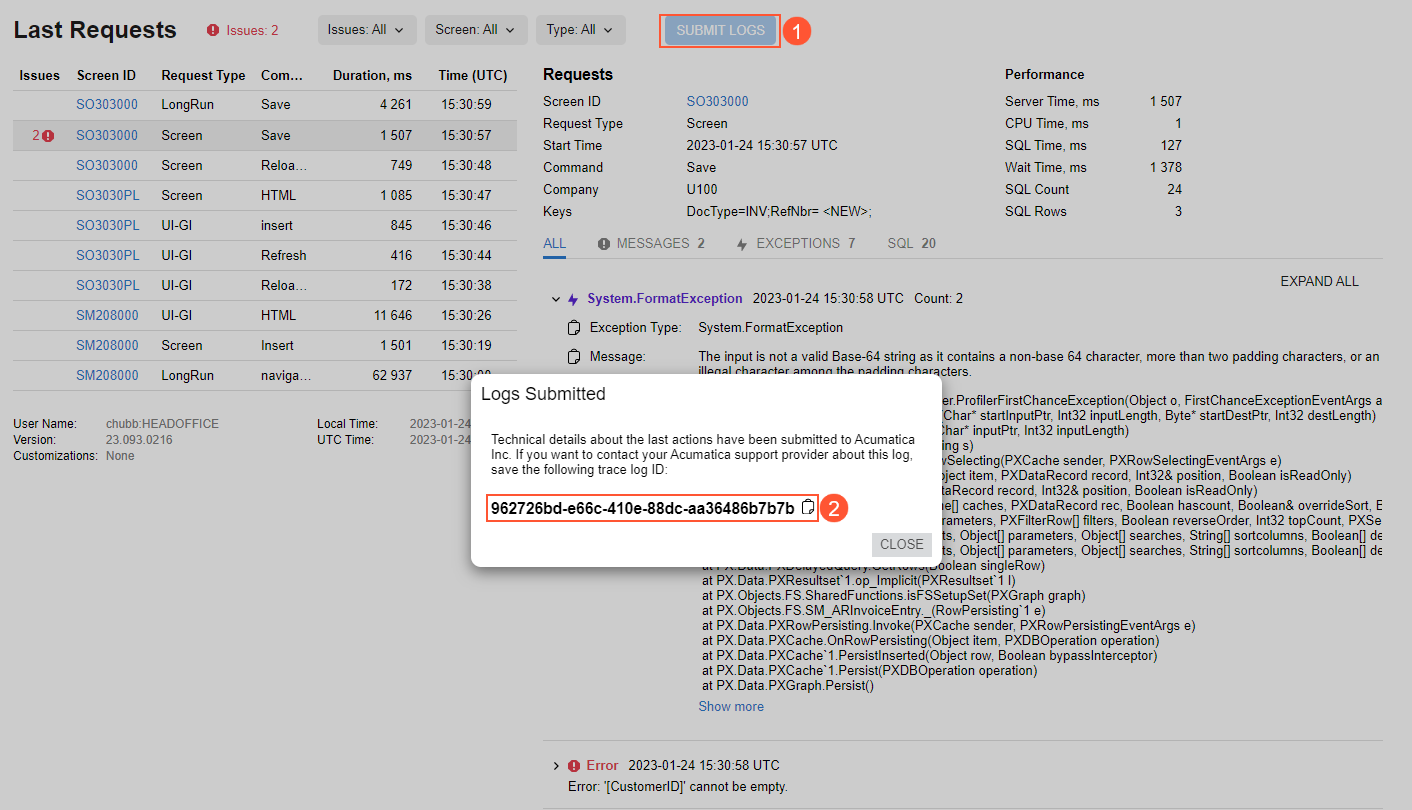
If you decide to report the issue to the MYOB Acumatica support provider of your company, you can specify the tag in the support request. The tag will help the support team to identify the diagnostic information related to the case.