Specific Widgets: To Add KPI Widgets
The following activity will show you how to add and configure scorecard, meter, and trend card widgets.
Story
Suppose that you are Kimberly Gibbs, a technical specialist in your company who is working on simple customizations. A sales manager of your company had previously requested a dashboard named Sales Mgr Dashboard. You had created the requested dashboard form. The sales manager has now requested that you add the following widgets to the dashboard to track the described KPIs:
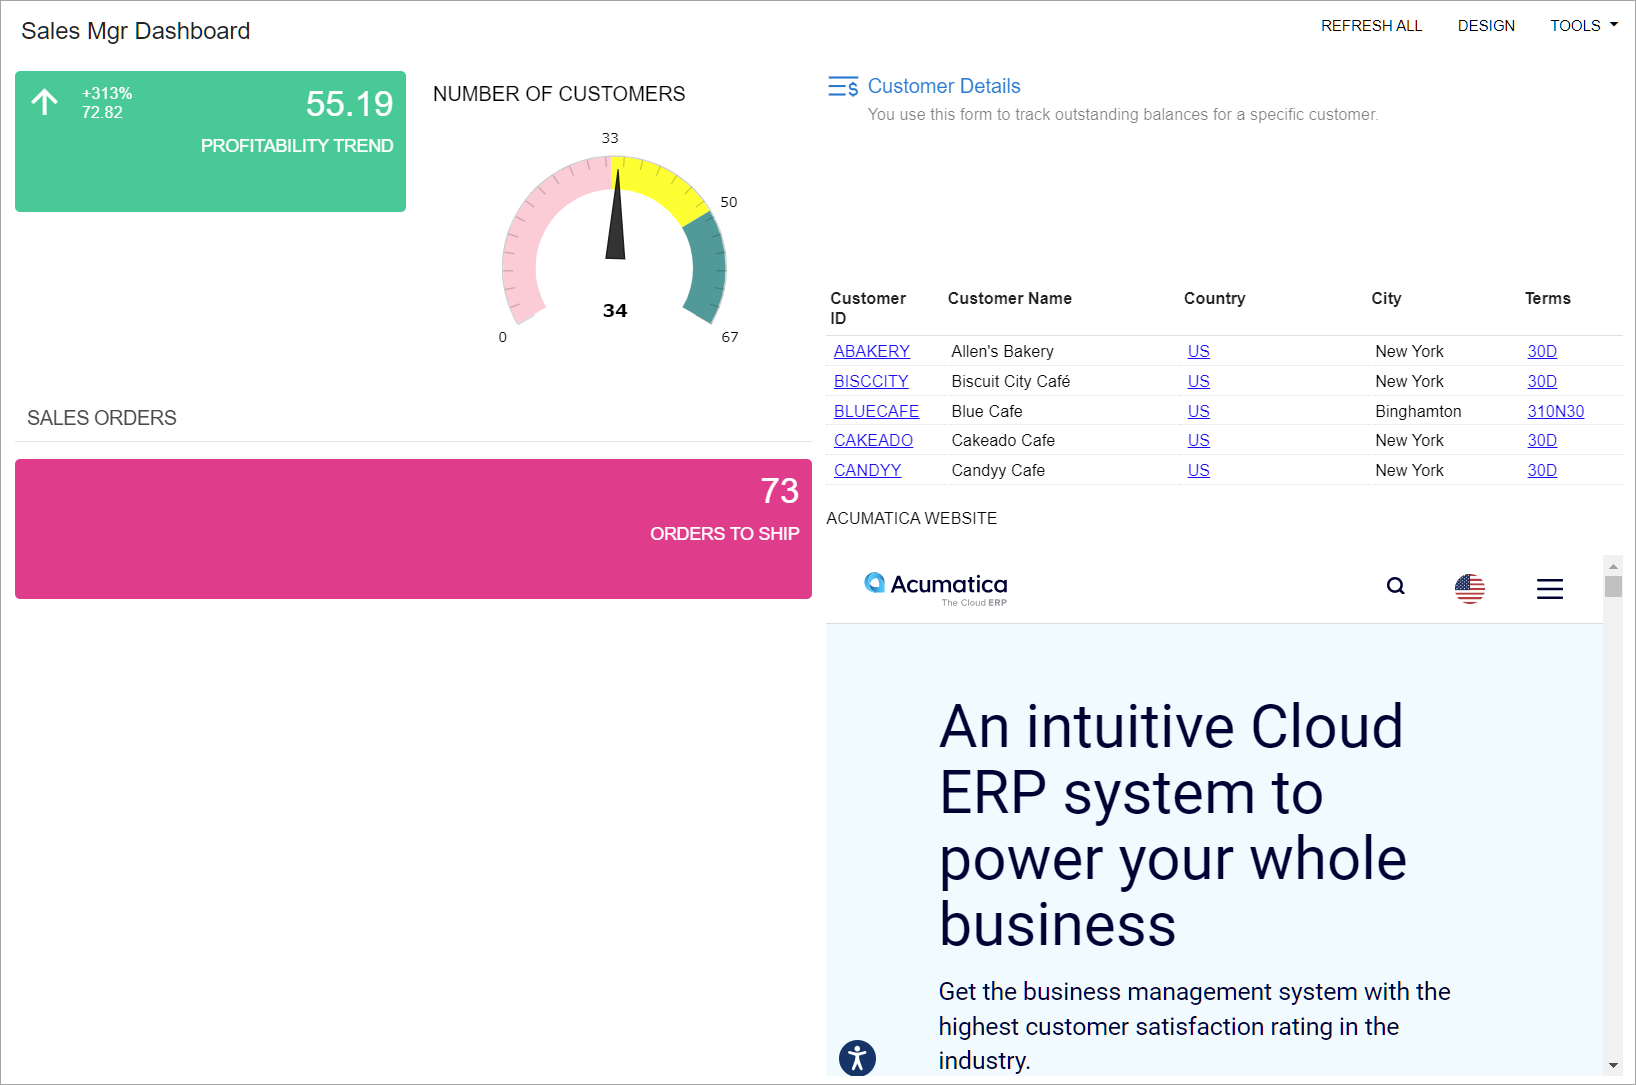
- Profitability Trend: The trend for the cumulative margin percentage in comparison to the previous week
- Number of Customers: The current number of customers (which is 33 at the moment) in comparison with the department goal to have at least 50 customers by the end of the next quarter
- Orders to Ship: The current number of sales orders ready to ship, which should not exceed 50 percent of the number the department defines as a high load (40 open orders at a time)
Also, the new KPI widgets should be located in the upper left corner of the dashboard, and the Orders to Ship widget should be separated from the upper widgets, which have the Sales Orders header.
Process Overview
In this activity, you will change the dashboard layout and rearrange the existing widgets to accommodate more widgets. Then you will add and configure widgets of the following types: trend card, meter, header, and scorecard.
System Preparation
Before you start adding the widgets, make sure that the following tasks have been performed:
- Launch the MYOB Acumatica website, and sign in to a tenant with the U100 dataset preloaded. You
should sign in as the system administrator by using the gibbs username
and the 123 password.Tip:The gibbs user is assigned the Administrator role, which has sufficient access rights to manage the system configuration and to modify generic inquiries, advanced filters, pivot tables, and dashboards.
- You have completed the Dashboards: To Add a Dashboard Form activity from this course. In this activity, you created the Sales Mgr Dashboard dashboard and made sure that a user with the Administrator role can populate the dashboard with the widgets.
- You have completed the Specific Widgets: To Add Link, Table, and Embedded Page Widgets activity.
- In the info area, in the upper-right corner of the top pane of the MYOB Acumatica screen, make sure that the business date in your system is set to 1/30/2025. If a different date is displayed, click the Business Date menu button, and select 1/30/2025 on the calendar.
Step 1: Modifying the Dashboard Layout
You previously added three widgets to the Sales Mgr Dashboard dashboard. You need to rearrange the existing widgets to free up the upper left corner for KPIs. To change the layout, do the following:
- On the main menu, click the Opportunities menu item to
open the Opportunities workspace, and click the Sales
Mgr Dashboard link. Tip:If the Opportunities menu item is not on the main menu, click the More Items menu item and then click the Opportunities tile.
- On the dashboard title bar, click the Design button.
- On the dashboard title bar, click the Edit Layout button.
- In the Dashboard Layouts dialog box, which opens, do the
following:
- Select the layout template where both working areas have the same width.
- Click OK. The dialog box is closed, and the dashboard widgets are arranged within the selected layout.
- Move the Customer Details, Customer Accounts, and Acumatica
Website widgets to the right working area, and modify their widths and
heights to accommodate the information they display. The modified dashboard
should be similar to the dashboard in the following screenshot.
Figure 1. The dashboard with the changed layout and rearranged widgets 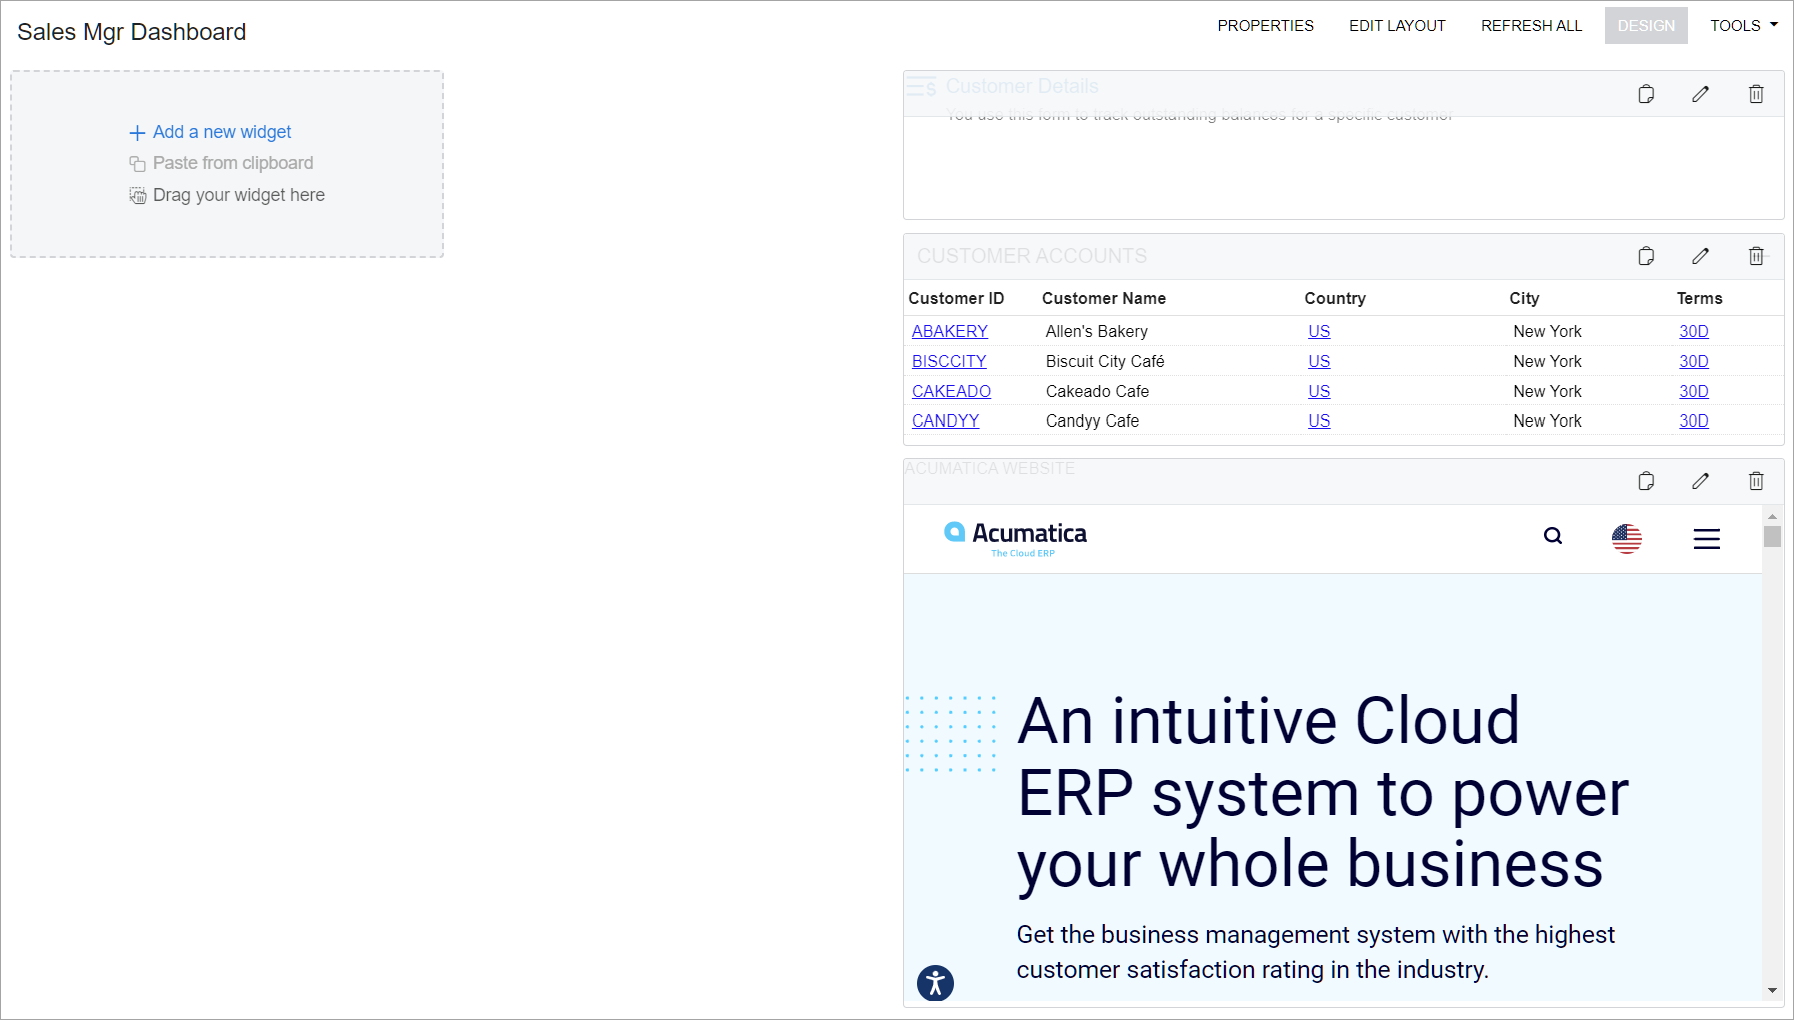
Step 2: Adding a Trend Card Widget
To add a trend card widget, do the following:
- While you are still in design mode of the Sales Mgr Dashboard dashboard, in the widget placeholder in the upper left corner, click Add a new widget.
- In the Add Widget dialog box, which opens, select Trend Card KPI and click Next.
- In the Widget Properties dialog box, which opens, specify
the following settings:
- Inquiry Screen: Sales Profitability Analysis (AR409000)
- Field to Aggregate: Margin %
- Aggregate Function: Average
- Timeline Field: Date
- Period: Last Week
- Rising Trend Color: Teal
- Flat Trend Color: Yellow
- Falling Trend Color: Pink
- Caption: Profitability trend
- Click Finish to save your changes and close the dialog box.
Step 3: Adding a Meter Widget
To add a meter widget, do the following:
- While you are still in design mode of the Sales Mgr Dashboard dashboard, in the widget placeholder next to the Profitability Trend widget, click Add a new widget.
- In the Add Widget dialog box, which opens, select Key Performance Indicator (KPI) and click Next.
- In the Widget Properties dialog box, which opens, specify
the following settings:
- Inquiry Screen: Customers (AR3030PL)
- Field to Aggregate: Customer ID
- Aggregate Function: Count All
- Normal Level Type: Fixed Value
- Normal Level: 33
- Alarm Level Type: Fixed Value
- Alarm Level: 50
- Normal Color: Pink
- Warning Color: Yellow
- Alarm Color: Teal
- Visualization Type: Meter
- Caption: Number of customers
- Click Finish to save your changes and close the dialog box.
Step 4: Adding a Header Widget
To add a header widget, do the following:
- While you are still in design mode of the Sales Mgr Dashboard dashboard, in the widget placeholder below the Profitability Trend widget, click Add a new widget.
- In the Add Widget dialog box, which opens, select Header and click Next.
- In the Widget Properties dialog box, which opens, type sales orders in the Caption box.
- Click Finish to save your changes and close the dialog box.
- Drag the right widget border to the right until it aligns with the right border of the working area.
Step 5: Adding a Scorecard Widget
To add a scorecard widget, do the following:
- While you are still in design mode of the Sales Mgr Dashboard dashboard, in the widget placeholder below the Sales Orders widget, click Add a new widget.
- In the Add Widget dialog box, select Key Performance Indicator (KPI) and click Next.
- In the Widget Properties dialog box, specify the
following settings:
- Inquiry Screen: Sales Orders (SO3010PL)
- Field to Aggregate: Order Nbr.
- Aggregate Function: Count All
- Normal Level Type: Percent Value
- Normal Level: 50
- Alarm Level Type: Fixed Value
- Alarm Level: 40
- Normal Color: Teal
- Warning Color: Yellow
- Alarm Color: Pink
- Visualization Type: Scorecard
- Caption: Orders to ship
- Click Finish to save your changes and close the dialog box.
- Drag the right widget border to the right until it aligns with the right border of the working area.
- On the dashboard title bar, click the Design button.
You have changed the dashboard layout and arranged the previously added widgets in the right working area. Then you have added widgets of the following types to the dashboard: trend card, meter, header, and scorecard (see the following screenshot).