Specific Widgets: To Add Chart Widgets
The following activity will show you how to add and configure chart widgets.
Story
Suppose that you are Kimberly Gibbs, a technical specialist in your company who is working on simple customizations. A sales manager of your company had previously requested a dashboard named Sales Mgr Dashboard, and you created the requested dashboard form. The sales manager has now requested that you add the following widgets to present the listed data:
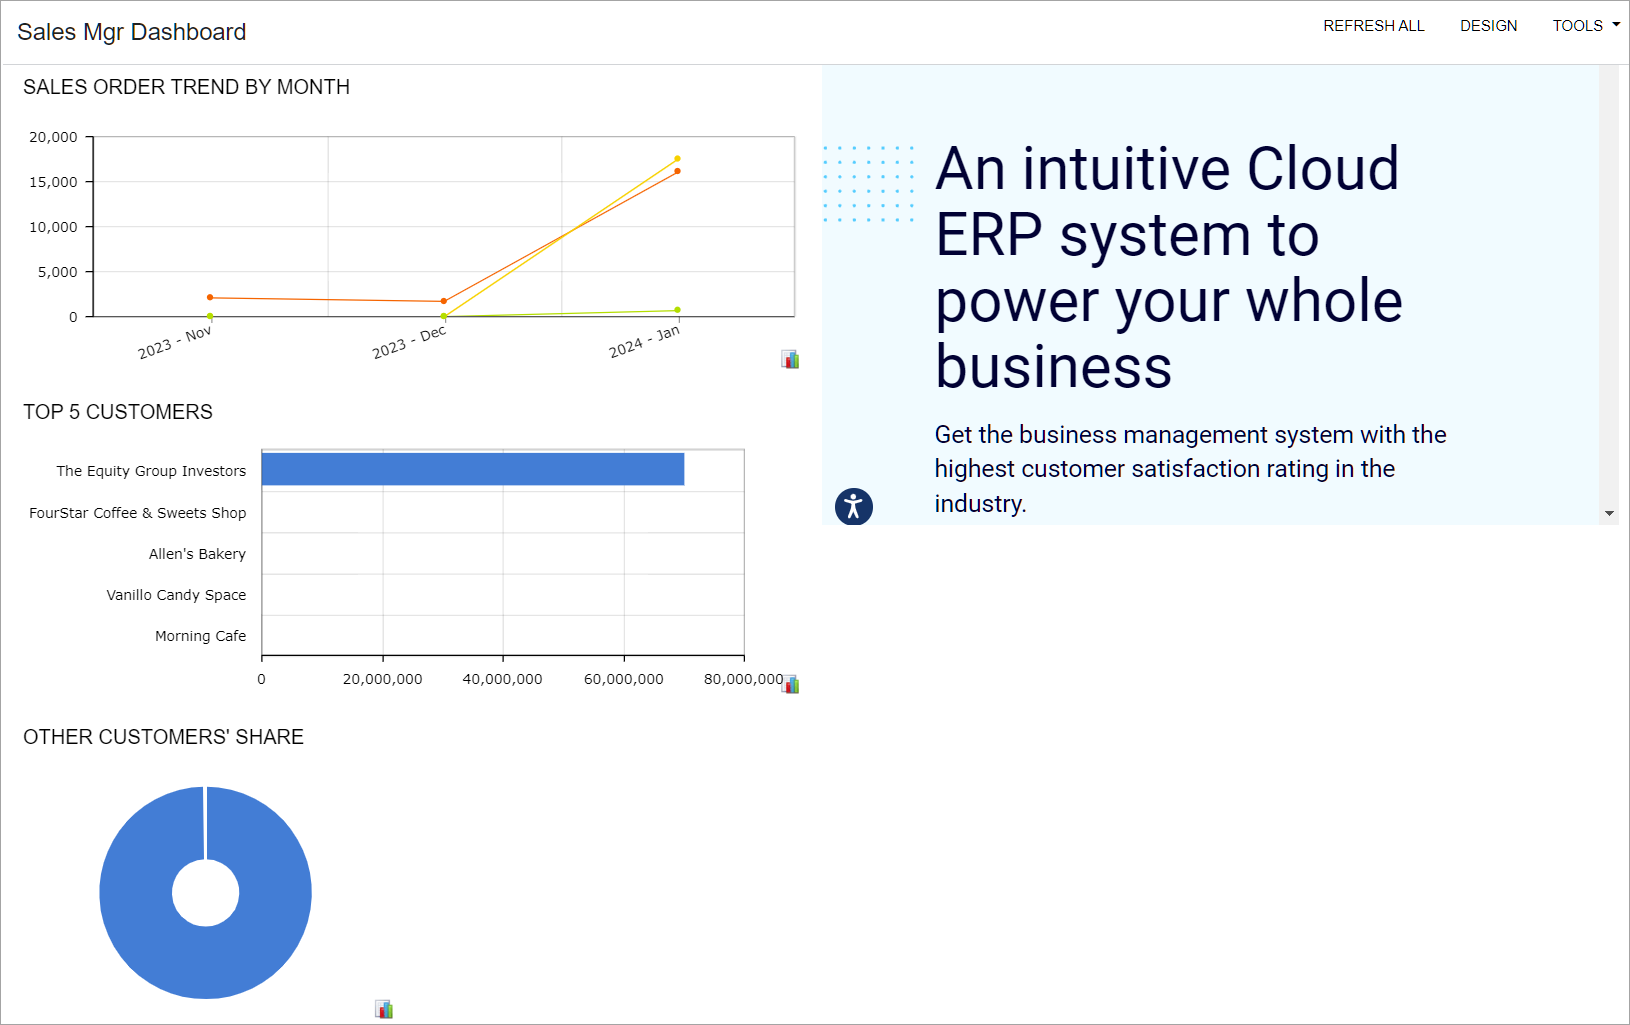
- Sales Order Trend by Month: The total amount of the sales orders by month
- Top 5 Customers: The top five customers by invoiced amount
- Other Customers' Share: The share of the total invoiced amount held by customers that are not among the top five customers by invoiced amount
Process Overview
In this activity, you will add and configure widgets of the following types: line chart, horizontal bar chart, and doughnut chart.
System Preparation
Before you start adding the widgets, make sure that the following tasks have been performed:
- Launch the MYOB Acumatica website, and sign in to a tenant with the U100 dataset preloaded as
system administrator Kimberly Gibbs by using the gibbs username and the
123 password.Tip:The gibbs user is assigned the Administrator role, which has sufficient access rights to manage the system configuration and to modify generic inquiries, advanced filters, pivot tables, and dashboards.
- You have completed the Dashboards: To Add a Dashboard Form activity. In this activity, you created the Sales Mgr Dashboard dashboard and made sure that a user with the Administrator role can populate the dashboard with the widgets.
- You have completed the Specific Widgets: To Add Link, Table, and Embedded Page Widgets activity.
- You have completed the Specific Widgets: To Add KPI Widgets activity.
- In the info area, in the upper-right corner of the top pane of the MYOB Acumatica screen, make sure that the business date in your system is set to 1/30/2025. If a different date is displayed, click the Business Date menu button and select 1/30/2025 on the calendar. For simplicity, in this activity, you will create and process all documents in the system on this business date.
Step 1: Adding a Line Chart Widget
To add a line chart widget, do the following:
- On the main menu, click the Opportunities menu item to open the Opportunities workspace, and click the Sales Mgr Dashboard link.
- On the dashboard title bar, click the Design button.
- In the widget placeholder under the Orders to Ship widget, click Add a new widget.
- In the Add Widget dialog box, which opens, select Chart and click Next.
- In the Widget Properties dialog box, which opens, specify
the following settings:
- Inquiry Screen: Sales Orders (SO3010PL)
- Caption: Sales Order Trend by Month
- Click Configure
- In the Chart Settings dialog box, which opens, in the Chart Type box, select Line.
- In the Categories section, specify the following
settings:
- Legend: Date
- Maximum Number of Values Shown: 12
- Date Rounding: Months
- In the Series section, in the Legend box, select Order Type.
- In the Values section, in the Value boxes, select Order Total and Sum.
- Click OK to save your changes and close the Chart Settings dialog box.
- Click Finish to save your changes and close the Widget Properties dialog box.
- Drag the right border of the widget to the right until it aligns with the right border of the working area.
Step 2: Adding a Bar Chart Widget
To add a bar chart widget, do the following:
- While you are still in design mode of the Sales Mgr Dashboard dashboard, in the widget placeholder under the Sales Orders Trend by Month widget, click Add a new widget.
- In the Add Widget dialog box, which opens, select Chart and click Next.
- In the Widget Properties dialog box, which opens, specify
the following settings:
- Inquiry Screen: Customer Summary (AR0008DB)
- Caption: Top 5 Customers
- Click Configure
- In the Chart Settings dialog box, which opens, in the Chart Type box, select Bar.
- In the Categories section, specify the following
settings:
- Legend: Customer Name
- Maximum Number of Values Shown: 5
- In the Values section, in the Value boxes, select Amount and Max.
- Click OK to save your changes and close the Chart Settings dialog box.
- Click Finish to save your changes and close the Widget Properties dialog box.
- Drag the right border of the widget to the right until it aligns with the right border of the working area.
Step 3: Adding a Doughnut Chart Widget by Copying the Bar Chart Widget
To add a doughnut chart widget, do the following:
- While you are still in design mode of the Sales Mgr Dashboard dashboard, on the title bar of the Top 5 Customers widget, click the Copy button. Notice that Paste from clipboard becomes available in the widget placeholders.
- In the widget placeholder under the Top 5 Customers widget, click Paste from clipboard.
- On the title bar of the pasted widget, click Edit.
- In the Widget Properties dialog box, which opens, click Configure
- In the Chart Settings dialog box, which opens, in the Chart Type box, select Doughnut.
- In the Categories section, select the Show Sum of Other Entries check box.
- Click OK to save your changes and close the Chart Settings dialog box.
- In the Widget Properties dialog box, to which you return, in the Caption box, type Other Customers' Share.
- Click Finish to save your changes and close the Widget Properties dialog box.
- On the dashboard title bar, click the Design button.
You have added to the dashboard chart widgets of the following types: line, bar, and doughnut (see the following screenshot).