- Contents
- Index
- Search

Show results that include all search words
Stock Master
Accounts > Stock
The stock master holds the inventory items, and their pertinent details.
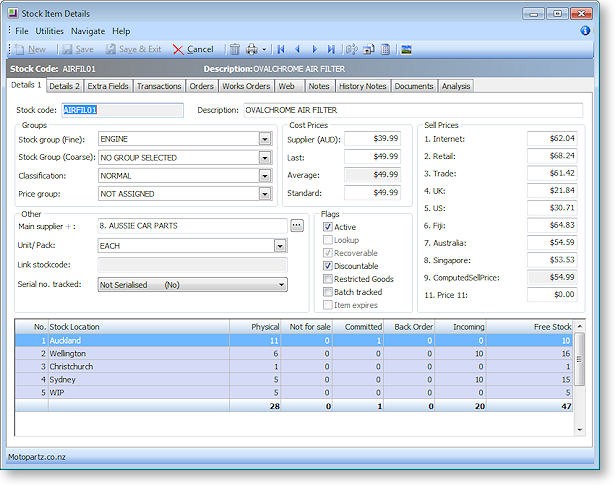
Details 1 – contains stock item code, description, groups, cost and sell prices, unit of measure, serial no. tracking method and stock levels per stock location.
Details 2 – holds the min/max stock, sales, purchase and COS GL codes, weight and cubic info, sales and purchase GST and the barcode and alternate codes.
Extra Fields – only available if extra fields have been set up.
Transactions – contains a list of transactions for the particular stock item, e.g. invoices, orders, receipts, adjustments, and transfers.
Orders – displays the orders related to the stock item. It contains three panels: sales orders, transfer requests and purchase orders.
Jobs – displays any jobs that the stock item is currently being used in. This tab is only available if EXO Job Costing is installed.
Works Orders – displays Works Orders associated with the stock item. This tab is divided into two panels: works orders to be produced and works orders to be used in production.
Web – contains fields that you need to use if you are displaying your stock on a website.
Batch Qty – only available if the enable stock batch codes have been enabled. This tab is used to assist in handling batch-tracked stock items
Notes – allows entry of ‘free-form’ notes pertinent to the stock item.
History Notes – this is like the Notes tab, but is more structured. This makes it easier to search for previous notes related to the stock item. It’s also easy to create, delete, or email history notes.
Documents – lists all the documents related to a stock item. It could be a word processing document, a graphical .gif or .avi file, or any document that is recognized by a Windows application.
Analysis – a quick preview of the sales status of the stock item. The graph displays the dollar value (depicted through a red line). Double-click on the graph to view the total units sold (blue line).
Note: The toolbar icons at the top of the stock item window change when moving between tabs.