- Contents
- Index
- Search

Show results that include all search words
Viewing Stock Sales Performance
Account > Stock > [Search] > {double click on a Stock item} > (Analysis)
(Understanding this Path above)
To view the sales performance of a Stock item, click the Analysis tab:
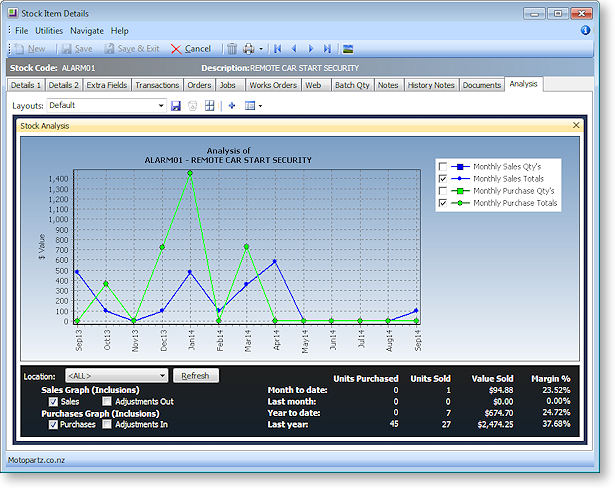
The graph provides a quick view of the sales status of the stock item. The graph displays the dollar value (depicted through a red line). Double-click on the graph to view the total units sold (blue line).
Note: Sales turnover figures represent deliveries of stock and this may not reconcile exactly with stock analysis by invoice line because of uninvoiced deliveries.