
Calendar Dashboards
On the calendar boards, the dashboards provide information in a calendar format where users can manage appointments and staff members' schedules in time. The following screenshot of the Calendar Board (FS300300) shows the main parts of a dashboard.
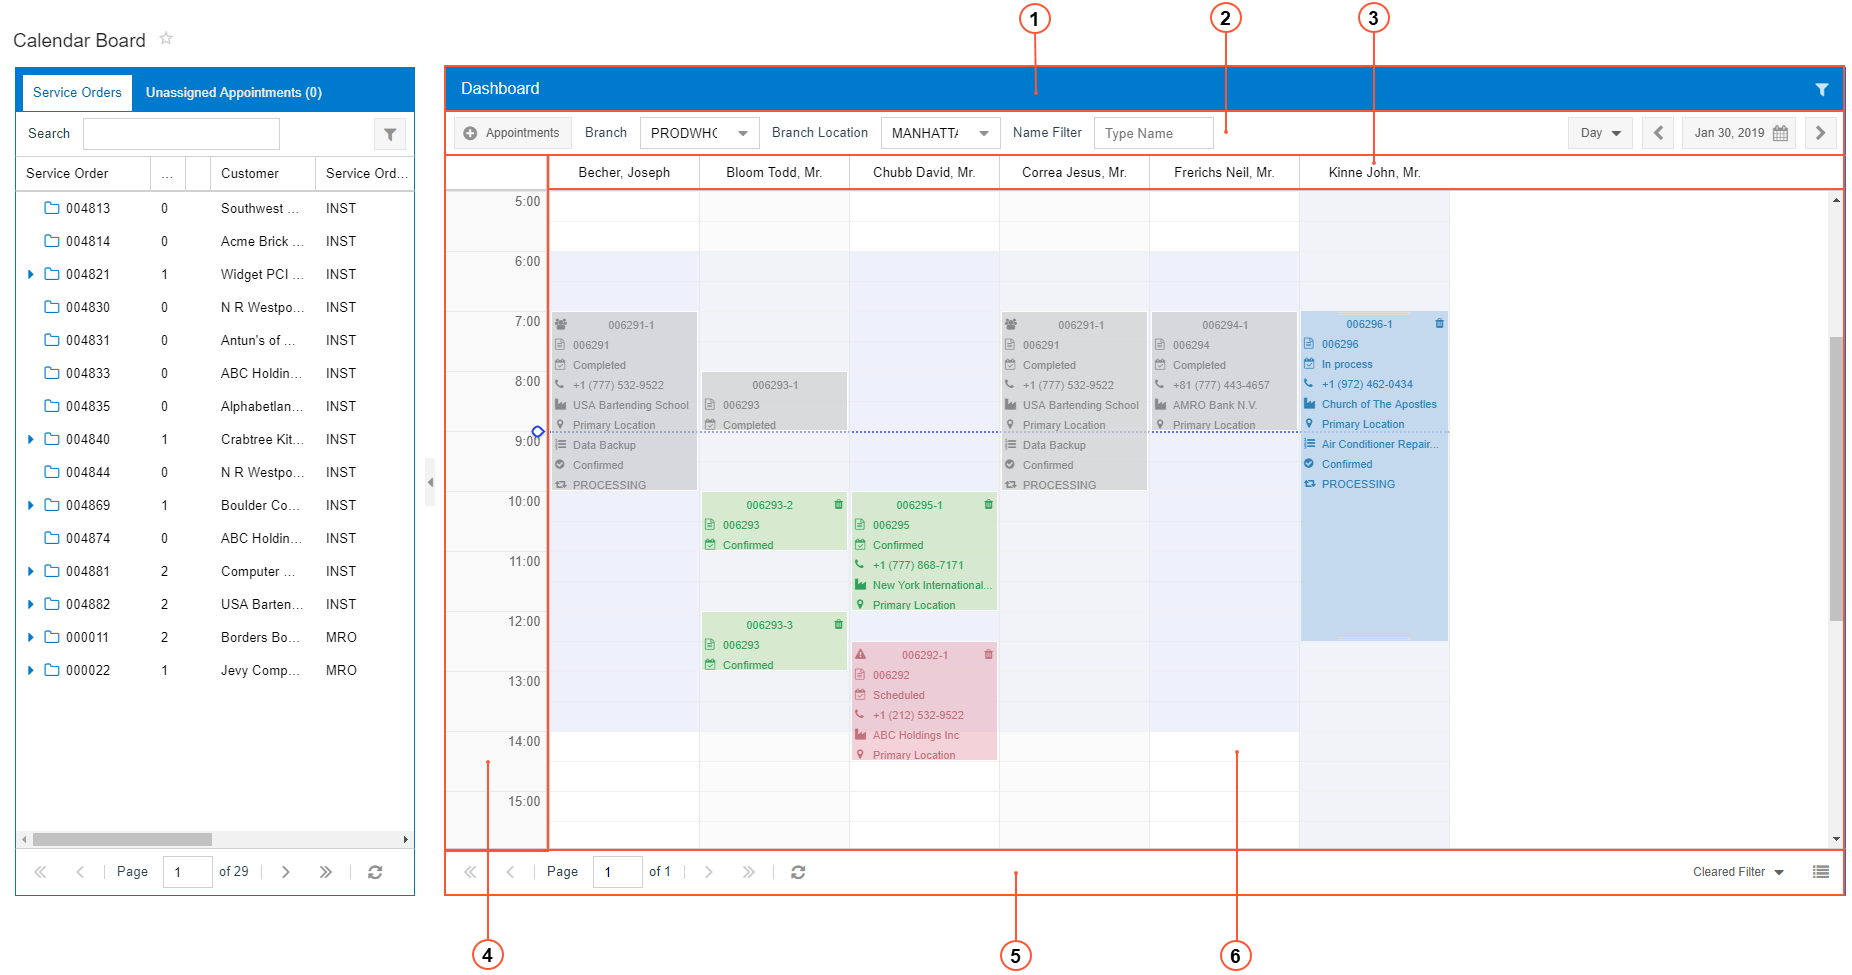
The dashboard on a calendar board includes the following parts:
- Dashboard Title Bar: A bar that contains form-specific elements that you can use to filter the dashboard information
- Dashboard Toolbar: A bar above the dashboard content that contains standard and form-specific elements that you can use to tailor the dashboard information
- Horizontal Axis: A part of the dashboard that defines the horizontal attribute for the dashboard content
- Vertical Axis: A part of the dashboard that defines the vertical attribute for the dashboard content
- Dashboard Footer: A bar below the dashboard content that displays navigation buttons, the View Mode button, and time resolution slider
- Dashboard: The content of the dashboard, which consists of an interactive calendar you can work with to schedule appointments, staff members, and rooms
Dashboard Title Bar
The dashboard title bar is located on the top of the dashboard. This bar can contain the Filter and Clear Filter buttons, which are described in following the table.
| Button | Icon | Description |
|---|---|---|
| Filter |
|
Opens the Staff Filters dialog box, which can be used to define a new filter. When you apply the filter and exit the dialog box, the information on the dashboard is updated. |
| Clear Filter |
|
Clears the filter settings. This button appears on the dashboard only if a filter has been applied to the dashboard. |
Dashboard Toolbar
The dashboard toolbar is located in the upper part of the dashboard. The toolbar can contain standard and form-specific elements. If a dashboard toolbar includes specific elements, they are described in the relevant form reference topic.
The following table describes the standard dashboard buttons. A dashboard toolbar may include some or all of these buttons.
| Button | Icon | Description |
|---|---|---|
| Previous Day or Date Range |
|
Shows the dashboard the day before the date indicated on the Day button (if you are viewing a day), a week before the date range indicated on the Date Range button (if you are viewing a week), or a month before the date range indicated on the Date Range button (if you are viewing a month). |
| Date or Date Range | Displays a particular date of the dashboard if you are viewing a day, or a particular date range if you are viewing a week or month on the calendar. To manually change the date, click this button and change the date in the Calendar dialog box. For details, see Calendar Dialog Box. | |
| Next Day or Date Range |
|
Shows the dashboard the day after the date indicated on the Day button (if you are viewing a day), a week after the date range indicated on the Date Range button (if you are viewing a week), or a month after the date range indicated on the Date Range button (if you are viewing a month). |
Horizontal Axis
On the Calendar Board (FS300300) and Room Calendar Board (FS300700) forms, which have multiple view modes, in the Vertical view mode, on the horizontal axis of the dashboard, staff members and rooms are shown, respectively. In the Horizontal view mode, times are shown on the horizontal axis.
On the Staff Calendar Board (FS300400) and Staff Working Schedule Board (FS300500) forms, dates are shown on the horizontal axis of the dashboard.
Vertical Axis
On the Calendar Board (FS300300) and Room Calendar Board (FS300700) forms, which have multiple view modes, in the Horizontal view mode, on the vertical axis of the dashboard, staff members and rooms are shown, respectively. In the Vertical view mode, times are shown on the vertical axis.
On the Staff Calendar Board (FS300400) and Staff Working Schedule Board (FS300500) forms, times are shown on the vertical axis of the dashboard.
Dashboard Footer
The Calendar Board (FS300300) and Room Calendar Board (FS300700) forms have a dashboard footer. You use the elements of the footer to browse the dashboard pages (if there are too many details to fit on one page), to change the view mode of the dashboard, and to change the time intervals of the dashboard.
| Element | Icon | Description |
|---|---|---|
| First Page |
|
A button you click to display the first page of the dashboard details. |
| Previous Page |
|
A button you click to display the previous page of the dashboard details. |
| Page N of M | A box that contains the current page (N) of the total pages of the dashboard details (M). You can manually indicate the page to which you want to navigate by typing in the N box. | |
| Next Page |
|
A button you click to display the next page of the dashboard details. |
| Last Page |
|
A button you click to display the last page of the dashboard details. |
| Refresh |
|
A button you click to refresh the dashboard content. |
| Time Filter | An option that indicates which time filter (if any) is applied to the dashboard to
limit the days and times shown. You can change the option manually; the following options
are available:
By default, the filter selected in the Time Filter box on the Calendars and Maps tab of the Service Management Preferences form is selected. |
|
| Minus |
A button that you click to reduce the time resolution on the calendar board. When you click this button, the system increases the time interval of each time slot. For instance, if each time slot represents a one-hour interval (such as 9:00 to 10:00) and you click this button once, each time slot will represent a two-hour interval (such as 8:00 to 10:00). This button appears on the dashboard only in the Horizontal view mode. |
|
| Time Resolution |
A slider that you move to change the time resolution of the calendar board. When you move the slider to the left, the system increases the time interval of each time slot. When you move the slider to the right, the system reduces the time interval of each time slot. This slider appears on the dashboard only in the Horizontal view mode. |
|
| Plus |
A button that you click to increase the time resolution on the calendar board. When you click this button, the system reduces the time interval of each time slot. For instance, if each time slot represents a one-hour interval (such as 9:00 to 10:00) and you click this button once, each time slot will represent a 15-minute interval (such as 10:00 to 10:15). This button appears on the dashboard only in the Horizontal view mode. |
|
| Horizontal View Mode |
Changes the orientation of the dashboard to horizontal. This button is displayed on the dashboard in the Vertical view mode. |
|
| Vertical View Mode |
Changes the orientation of the dashboard to vertical. This button is displayed on the dashboard in the Horizontal view mode. |
Dashboard Content
On the dashboard you can see the appointments scheduled for the selected date or date range, the working hours, and the current time. You can use this area to reschedule existing appointments or create new ones.
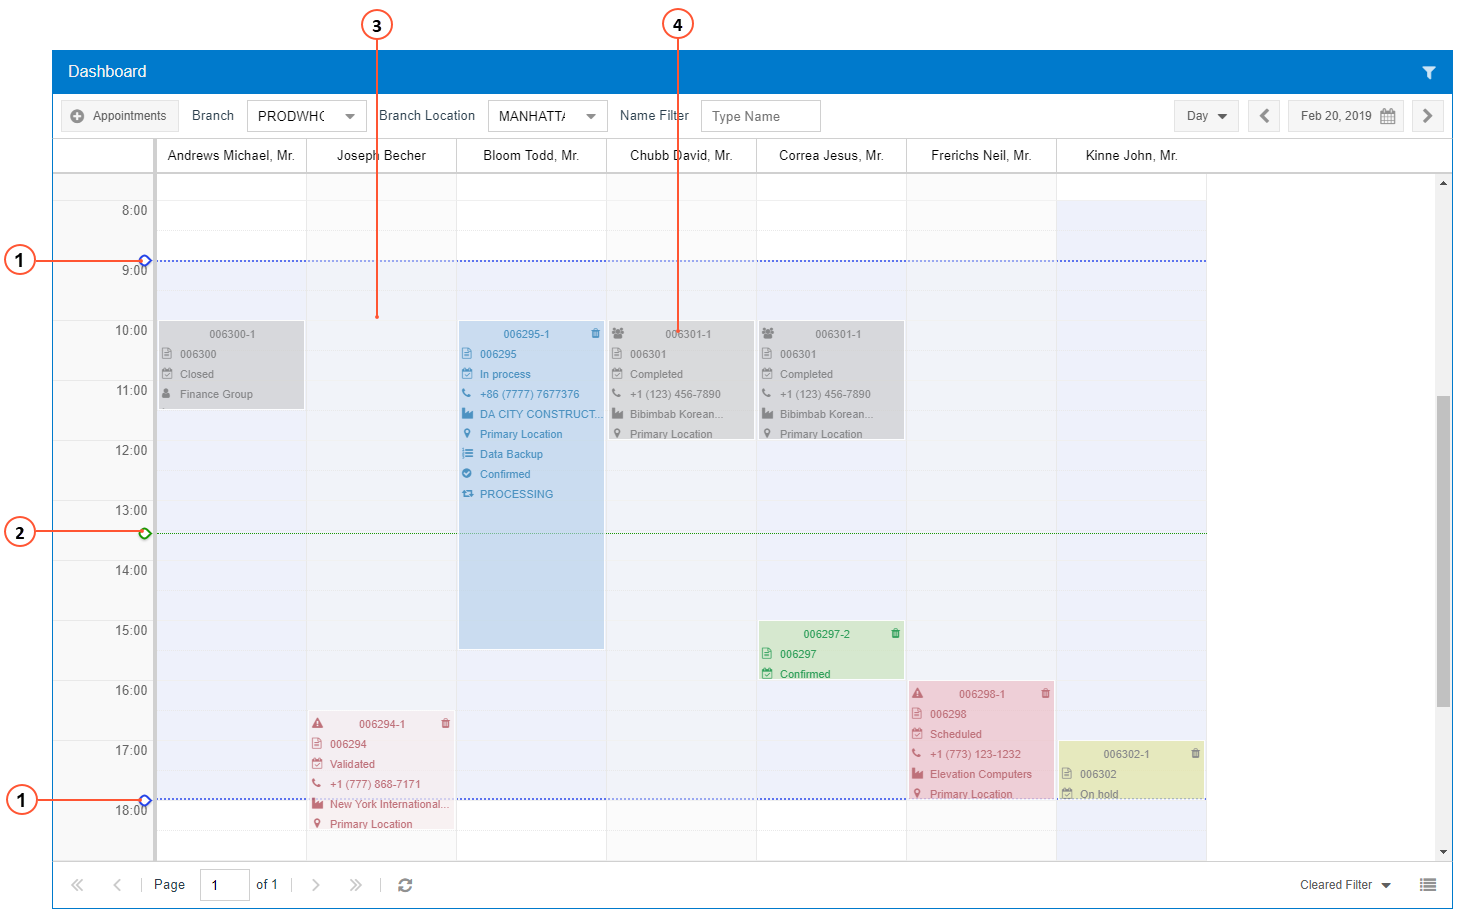
The dashboard content includes the following elements:
- Blue guides: Horizontal or vertical (depending on the orientation of the dashboard) lines that represent the start and end times of the working calendar selected in the Work Calendar box on the Calendars and Maps tab of the Service Management Preferences (FS100100) form.
- Green guide: A horizontal or vertical (depending on the orientation of the dashboard) line that indicates the current time.
- Staff working schedule: A series of boxes that represent the staff working schedule. The color of the box depends on the availability. If the color is blue, the staff member is available; if the color is red, the staff member is unavailable.
- Appointment: A shaded box that represents a scheduled appointment and its time range. For details about appointments, see Appointments on the Calendar Boards.
- Watch Icon: An icon that appears when you move the cursor through the dashboard and shows the time at which cursor is pointing.