- Contents
- Index
- Search

Display results with all search words
Design Tab - Advanced Components Toolbar
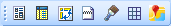
The tools on the Advanced Components toolbar let you add more components that help you deal with more complex reports.
|
Button |
Name |
Description |
|
|
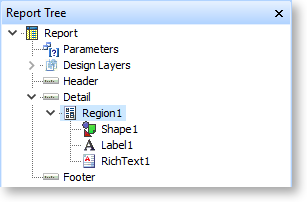
Region |
Adding a region to a report lets you group other components together. Once you've added a region component, you can place existing components on it by dragging them onto the region, or you can create new components in the region by clicking the button for the kind of component you want to add, then clicking directly on the region. The Report Tree shows which components are grouped under a region:
When the region is moved, all components on it move as well. If a region is made invisible, all components on it become invisible as well. |
|
|
SubReport |
Adds a sub report to the report. |
|
|
CrossTab |
Adds a crosstab to the report, which summarises grouped or aggregated data from database tables in a spreadsheet-like grid format. |
|
|
Page Break |
Adds a page break in the report, allowing you to control the report's pagination more precisely. |
|
|
PaintBox |
Adds a paintbox area to the report, which acts as a mini canvas that can be drawn on programmatically using the Calc tab. You can use the PaintBox component to create shapes and text that might otherwise be impossible using other report components. |
|
|
TableGrid |
Adds a table layout to the report. Other components can be placed inside each cell of the table, in the same way that components can be placed in a region. Right-click on the table to add rows and columns. |
|
|
Google Map |
Adds an image displaying a map from Google Maps. Use the component's properties on the Report Tree to control what appears on the map:
See the Google Maps documentation for more information on Google Map settings and parameters. Note: As with all components, you can change a Google Map component's properties using code entered on the Calc tab. This allows you to change a map's appearance dynamically, e.g. by loading the values of Debtor accounts' address fields into the component's Address property, you can display a map next to each Debtor record showing its address. |