- Contents
- Index
- Search

Display results with all search words
Tables
You can organise a report into a table layout by adding a TableGrid component, then placing other components onto the table. As the table is moved or resized, all components on the table will move and resize with it.
Adding Tables
To add a table, click the TableGrid button (  ) on
the Advanced Components
toolbar, then click on the report canvas in the place where you want
the table to appear.
) on
the Advanced Components
toolbar, then click on the report canvas in the place where you want
the table to appear.
By default, a table contains a single row with three table cells in it. You can set up the table's layout using its right-click options:
|
Option |
Description |
|
Row |
Submenu containing the following options:
|
|
Column |
Submenu containing the following options:
|
|
Cell |
Submenu containing the following options:
|
Editing Tables
Once you have added the table, you can add components to it by clicking on a component's toolbar button, then clicking on the table cell you want to place it in. The Report Tree shows all cells of the table in a tree structure, including the components that are inside each cell:

You can click on the parts of the table in the Report Tree to select that part on the report canvas, e.g. in the screenshot above, clicking on TableGrid1 in the report tree will select the entire table, while clicking on TableRow3 will select all cells in that row. You can hold down SHIFT while clicking on parts of the table (on the canvas or on the Report Tree) to select multiple cells at once.
Note: You can also right-click on any part of the table on the Report Tree to access the right-click options for that row, column or cell.
The controls on the Draw toolbar can be used to set the fill and line colours of the selected table cell(s).
You can move the table by clicking on any part of the table on the report canvas and dragging it into a new position. (Be sure to click on the table itself, not on a component that has been placed on a table cell - if you click on one of the child components, it will just move that component.)
You can resize the table by clicking and dragging on the edges of the table. Resizing can be done in two ways:
- When any part of the table has been selected, circles appear at the edges of the table. Click and drag a circle to resize the entire table - all cells will be resized.
- When the table is not selected, you can hover the mouse over the borders of an individual cell, then click and drag to resize only that row or column.
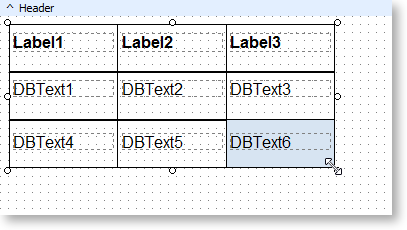
In the screenshot below, the lower right cell of the table has been clicked on. The cell is highlighted, and circles appear at the edges. You can see that hovering the mouse over one of the circles changes the mouse pointer to show that you can click to resize the whole table:
In the following screenshot, no part of the table is selected. Moving the mouse over a cell's border lets you drag just that border to resize individual rows or columns. In this case, the pointer indicates that you can drag left or right to change the column's width:
