Advanced Planning and Scheduling: Production Schedule Board
You can view the production schedule in a graphical format by using the Production Schedule Board (AM215555) form. On this form, a Gantt chart illustrates the schedule for the selected production orders over time.
This topic describes the graphical parts of the Production Schedule Board form.
Parts of the Schedule Board
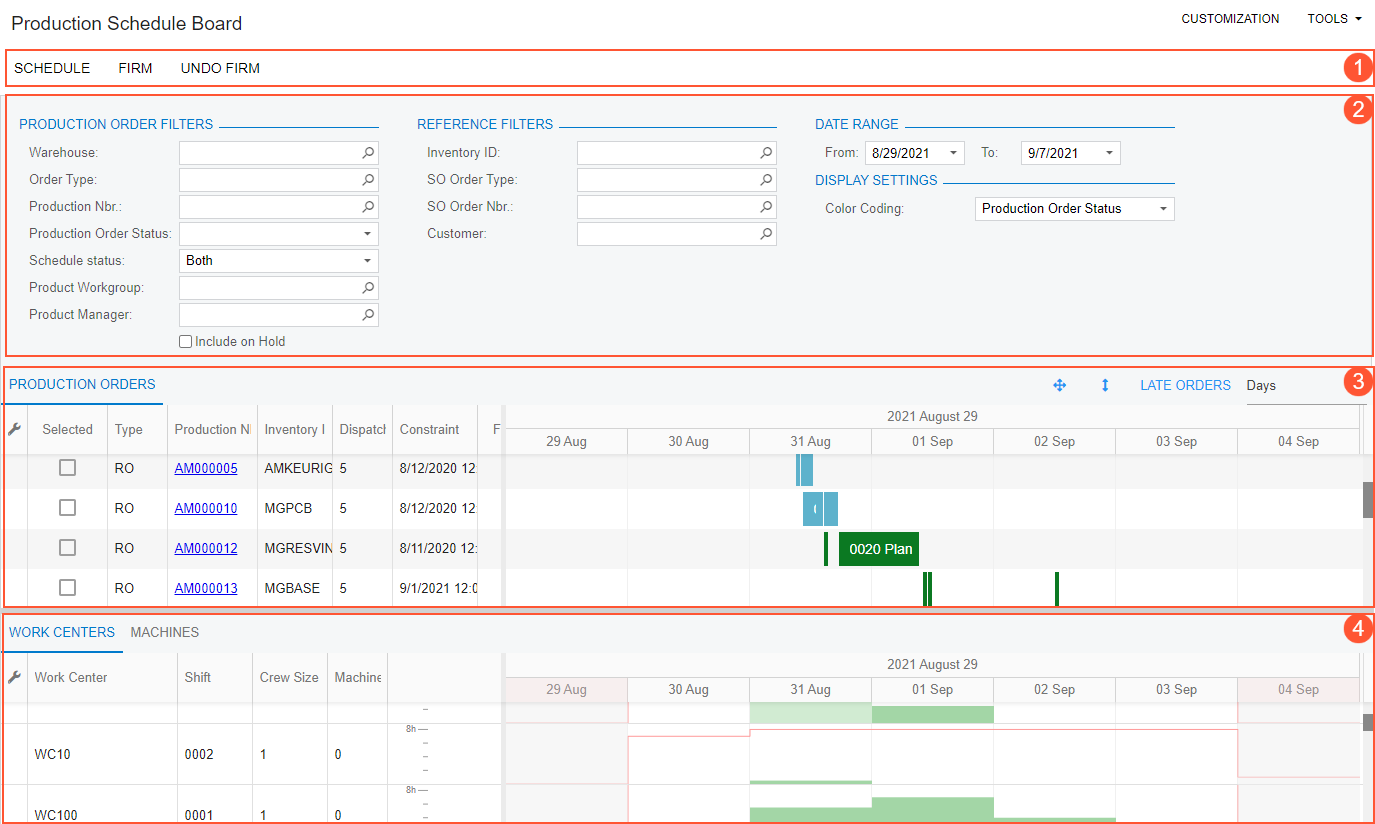
The schedule board consists of the following parts, whose numbers correspond to those in the screenshot below:
- The form toolbar. For descriptions of these buttons, see Production Schedule Board.
- The Selection area. The elements in this area are described in Production Schedule Board.
- The upper pane, which has the Production Orders tab. The tab displays the list of production orders that meet the selection criteria, and the Gantt chart for each production order. For details, see the Production Orders Tab (Upper Pane) section below.
- The lower pane, which has the Work Centers and Machines tabs. These tabs contain lists of all work centers and machines, showing histograms with details about the available and scheduled capacity for each work center and machine. For more information, see the Work Centers and Machines Tabs (Lower Pane) section below.
Production Orders Tab (Upper Pane)
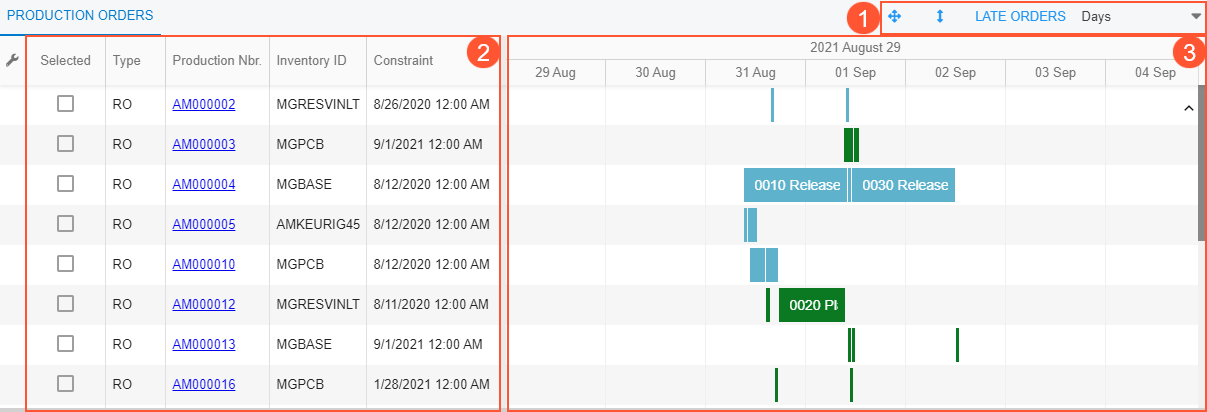
The Production Orders tab (in the upper pane) displays production orders and their schedules. This tab consists of the following parts, whose numbers correspond to those in the screenshot below:
- The upper pane toolbar. For descriptions of its elements, see the Upper Pane Toolbar section below.
- The list of production orders. For descriptions of its columns, see Production Schedule Board.
- The Gantt chart with details about the operations of each production order. For the chart description, see the Gantt Chart for Production Orders section below.
Upper Pane Toolbar
The pane toolbar is located in the top right corner of the upper pane. The toolbar elements are described in the following table.
| Element | Icon | Description |
|---|---|---|
| Full Screen | A button you click to display the panes in full screen mode. In this mode, the system hides the form title bar and the Selection area. | |
| Maximize | A button you click to hide the lower pane and display only the upper pane. | |
| Late Orders | A button you click to display only production orders with commitment dates that have passed. | |
| Timescale | A box that displays the current timescale for the Gantt chart. In
the box, you can select any of the following options:
|
Gantt Chart for Production Orders
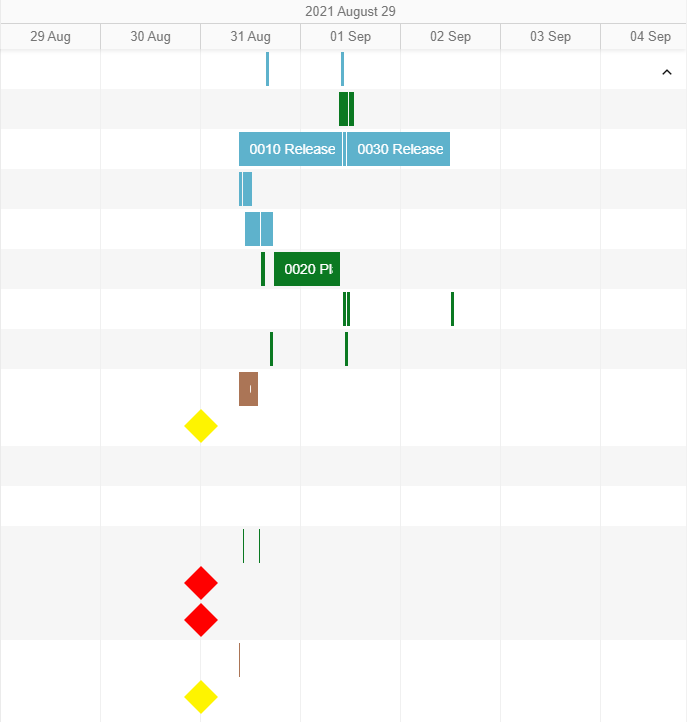
Any of the following graphical elements may be used on the chart:
- A bar, which represents an operation of a production order and is displayed as
follows:
- The length corresponds to the duration of the operation—that is, the start date and time, and end date and time.
- The label displays the operation number.
- The color represents the option specified in the Color Coding box of the Selection area. If Production Order Status is selected, for instance, each color corresponds to a particular order status.
- A diamond shape, which indicates that the production order is linked to a sales
order. The system compares the Requested On date of the
sales order, which is in the Summary area of the Sales Orders (SO301000) form, to the
End Date in the production order, which is on the
General tab of the Production Order Maintenance (AM201500) form. Based on this
comparison, the color of the shape means one of the following:
- Green: The date the items are requested on in the sales order is later than the End Date in the production order. That is, the production order meets the date commitment.
- Yellow: The date the items are requested on in the sales order is the same as the End Date in the production order. That is, the production schedule is tight, and production dates should not be shifted later to meet the commitment.
- Red: The date the items are requested on in the sales order is earlier than the End Date in the production order. That is, the production order does not meet the commitment.
- A lightening bolt icon, which indicates that the on-hand quantity of some materials required for the operation is insufficient.
- A white circle shape, which indicates that the operation is performed outside of the organization.
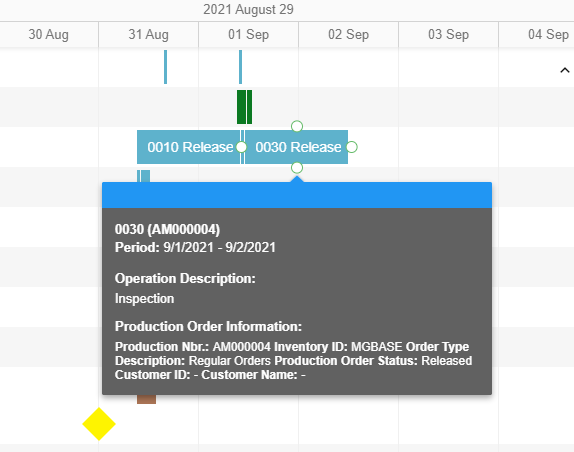
You can point to a graphical element and view the details of the scheduled operation and the related production order (see the following screenshot).
Work Centers and Machines Tabs (Lower Pane)
The Work Centers and Machines tabs (in the lower pane) display lists of work centers and machines, respectively, and histograms for their schedules. These tabs consist of the following elements, whose numbers correspond to those on the Work Centers tab in the screenshot below:
- The list of work centers (or machines on the Machines tab). For descriptions of the columns, see Production Schedule Board.
- The histogram for the work centers (or machines on the Machines tab).

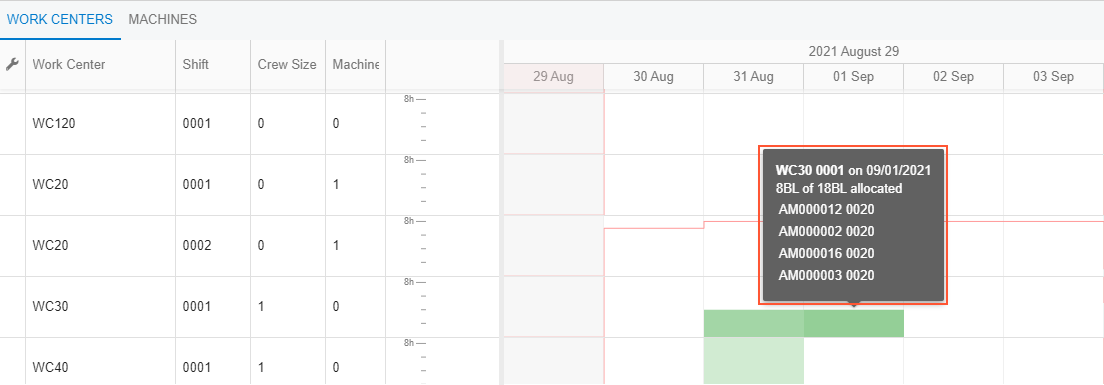
The histograms for work centers and machines consist of bars. The height of each bar represents the workload of the work center or machine resource for a particular timescale unit. The red line represents the maximum capacity of each work center or machine resource. You can point to the bar to view details about the work center or machine workload (see the following screenshot).
