UI Events: Debugging the UI Code in the Browser
You can debug any typescript code including the code of event handlers using developer tools.
On the Sources tab of the developer tools, you can find the source code of the form. You can use this code for debugging.
build-dev command. For details about building the source code, see Modern UI Development: Building the Source Code.You can set a breakpoint in the code. When the breakpoint is hit, in the Console tab in the bottom of the Sources tab, you can type the name of the variable to see its value, type an expression to evaluate it, or change the value of a variable to check how the system works with this value.
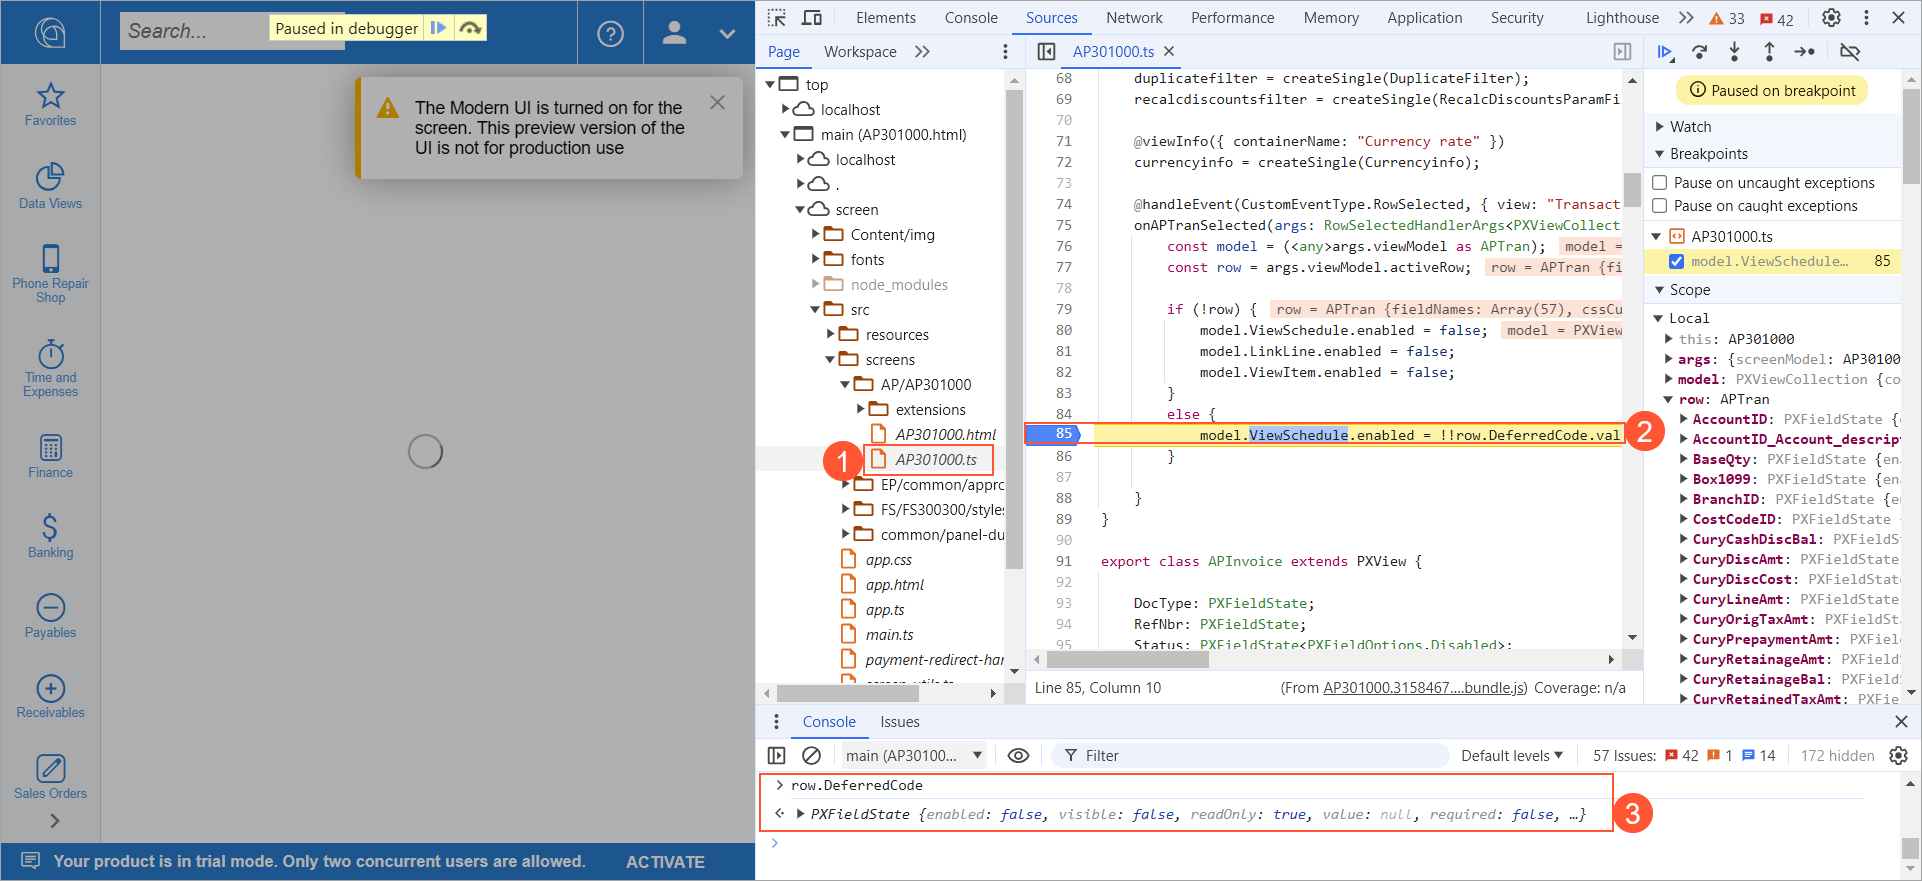
For example, in the following screenshot, the TypeScript code of the Bills and Adjustments (AP301000) form is open, as Item 1 shows. A
breakpoint is set for a line in the code (Item 2). This breakpoint is hit during the opening
of the form, and the debugger has stopped on this line. In the console, the
row.DeferredCode name has been entered, and the value of this variable is
displayed (Item 3).