Activity 7.2.1: To Implement and Debug an Event Handler
This activity will walk you through implementing an event handler and debugging it by using the developer tools in the browser.
Story
Suppose that you need to highlight the second line in a table in bold and print the message in the Console window when it happens.
Process Overview
You will implement the GetRowCss event handler, in which you will print the message in the Console window and return the new CSS class for the second line of a table. Then you will debug the code by using the developer tools.
Step 1: Implementing the Event Handler
To implement the GetRowCss event handler, do the following:
- In the
RS301000screen class of the RS301000.ts file, add the following event handler.export class RS301000 extends PXScreen { ... @handleEvent(CustomEventType.GetRowCss, { view: "RepairItems" }) getTransactionsRowCss(args: RowCssHandlerArgs) { } }You’ve used the handleEvent decorator to indicate that the method is an event handler. As the first parameter of the decorator, you’ve specified the type of the event, and in the second parameter, you’ve specified the view for which the event handler is intended.
- In the body of the event handler, check the number of the row, print the message
in the Console window, and return the name of the CSS class in string
format.
  @handleEvent(CustomEventType.GetRowCss, { view: "RepairItems" })
	getTransactionsRowCss(args: RowCssHandlerArgs) {
		if (args?.selector?.rowIndex === 1) {
			console.log("Row CSS changed", args);
			return "bold-row";
		}
		return undefined;
	}
Note: You can find the names of the available CSS classes in the FrontendSources/screen/static/custom.css file. - Rebuild your code.
Step 2: Test the Event Handler
To test the event handler, do the following:
- Refresh the Repair Work Orders (RS301000) form.
- Create a repair work order with the following settings:
- Customer ID: C000000001
- Service: BATTERYREPLACE
- Device: NOKIA3310
- On the Repair Items tab, two lines appear.
The second line is bold, as shown below.
Figure 1. The bold line on the Repair Items tab 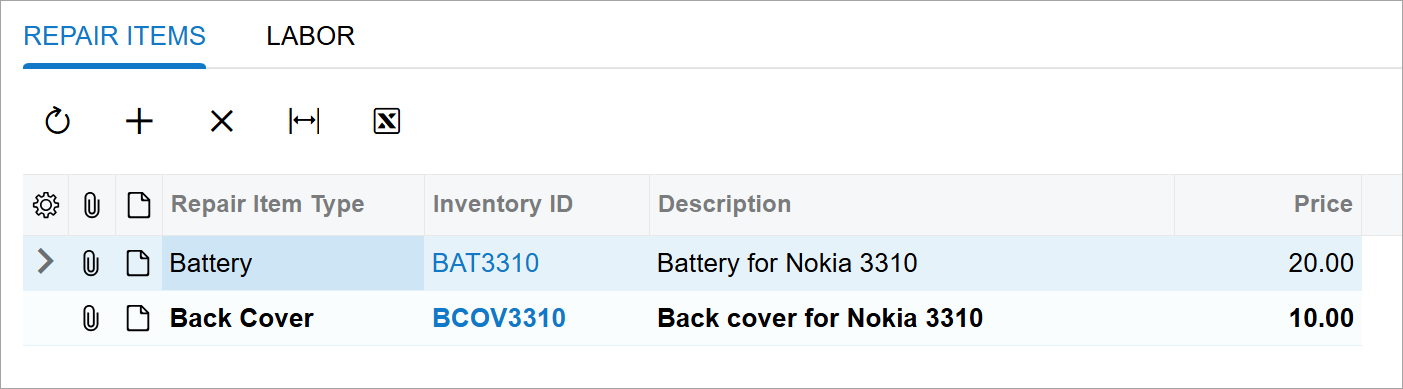
Step 3: Debugging the Code
To debug the code of the event handler, do the following:
- Open the developer tools of your browser.
- Open the Sources tab (Item 1 below).
Figure 2. The developer tools window 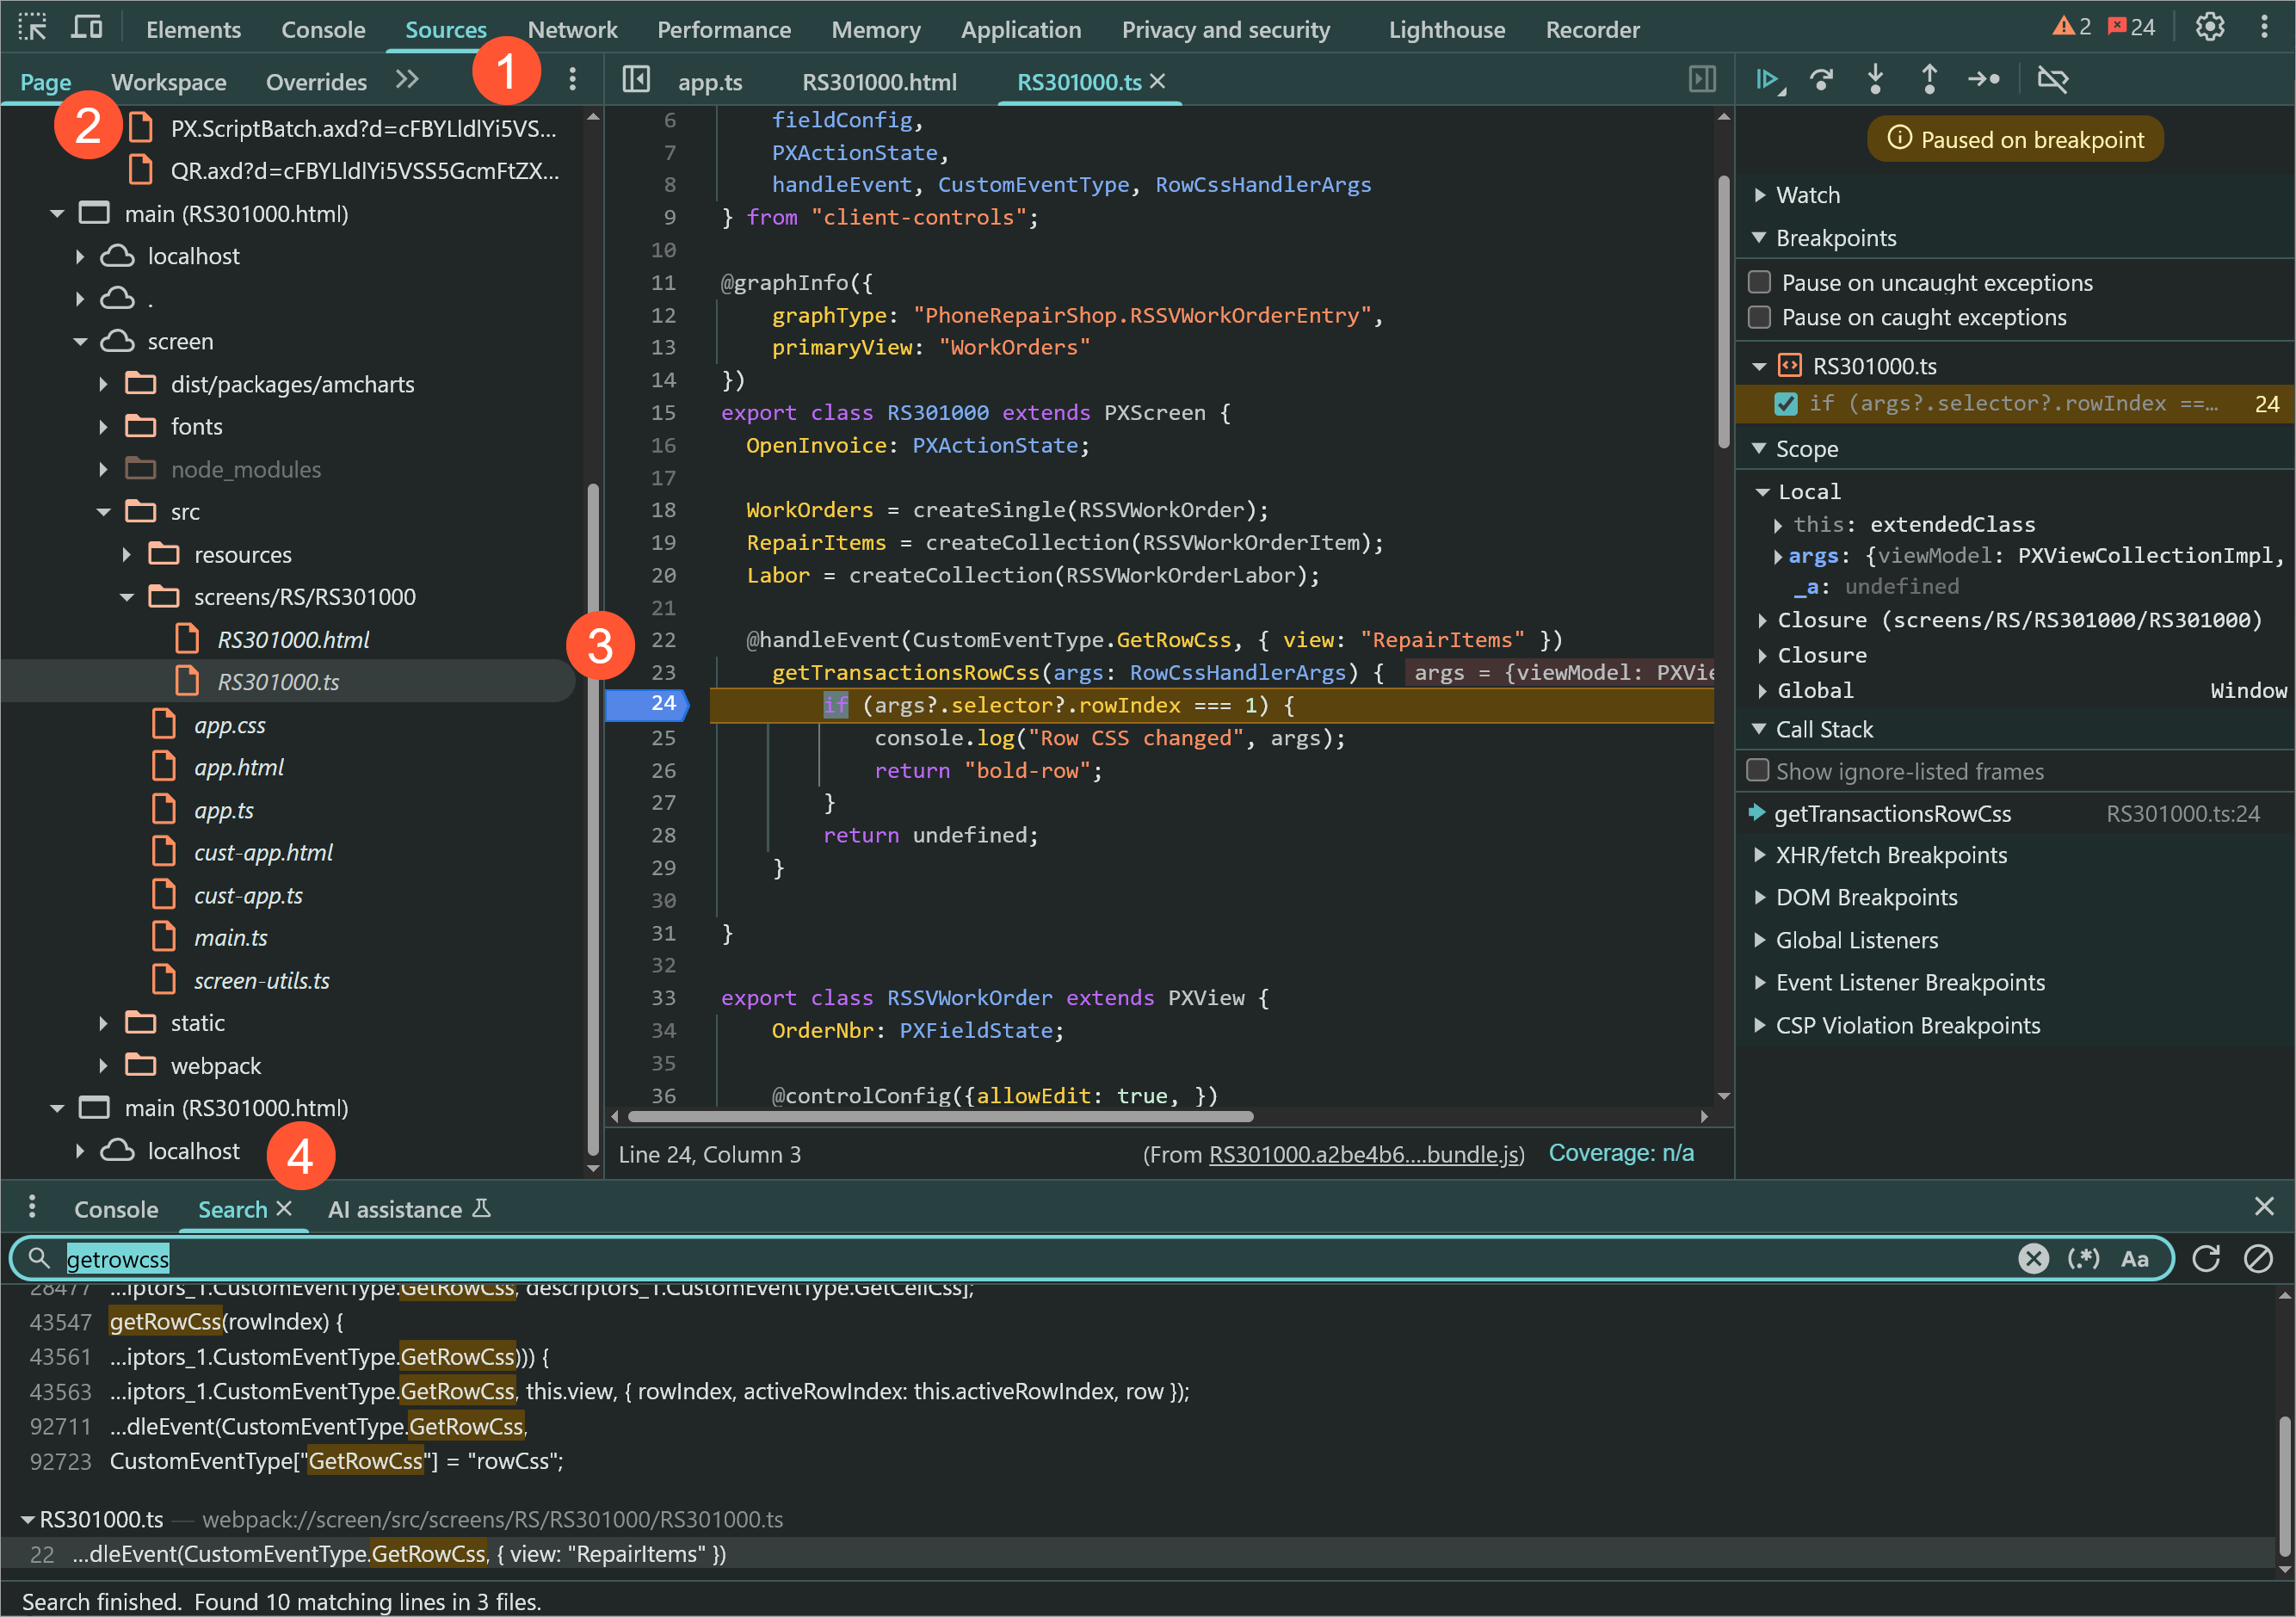
- On the Page tab (Item 2 above), locate the source code of
the RS301000 screen according to the following
path.
top/main (RS301000.html)/screen/src/development/screens/RS/RS301000/RS301000.tsNote: You can also search for the needed line on the Search tab (Item 4) of the developer tools. - Put the breakpoint on line 24 (Item 3).
- Open the Repair Work Orders (RS301000) form.
- Create a new repair work order with the same settings as you entered in the previous step.
- When the breaking point is hit, go through the steps for the first line and the second line of the table on the Repair Items tab.
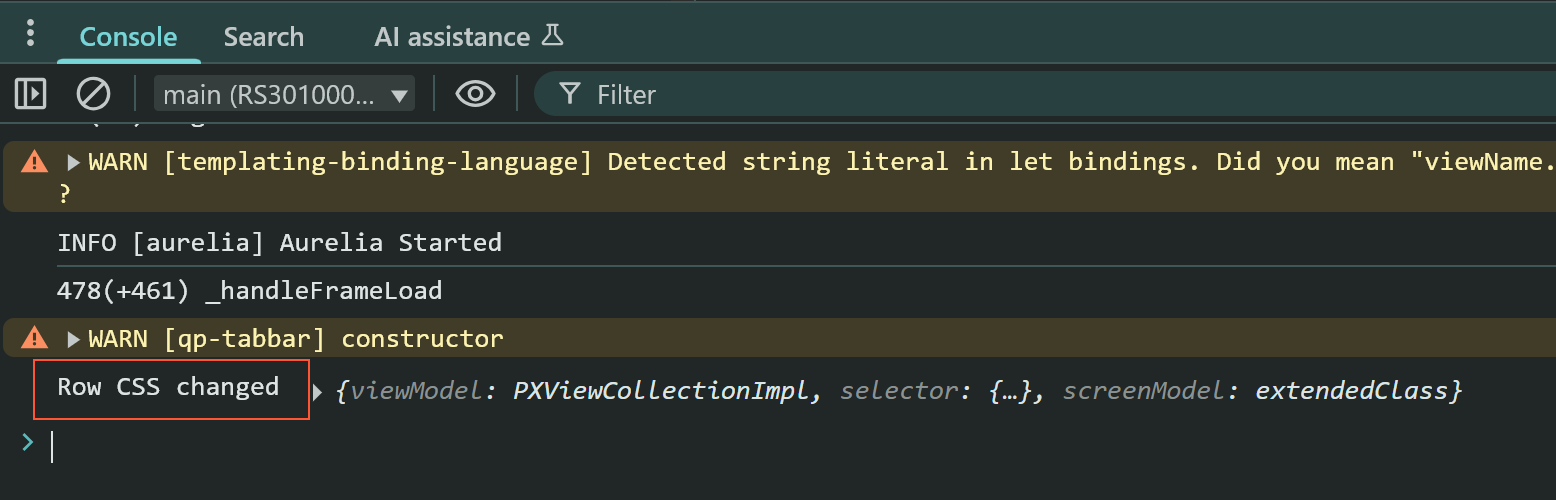
- On the Console tab, notice the messages from the event
handler, as shown below.
Figure 3. The Console tab