Job Overview
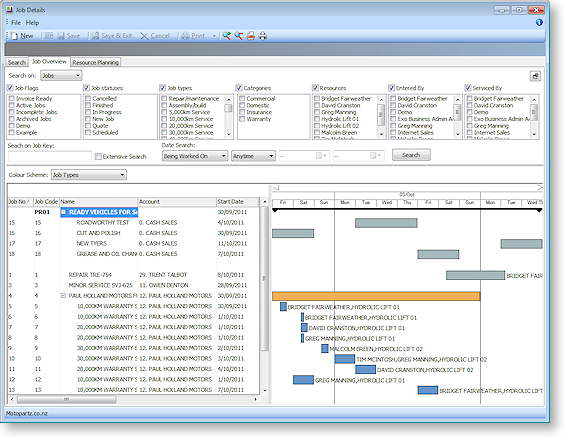
The Job Overview tab of the Job Management screen displays a Gantt chart, providing a graphical representation of projects and jobs with their scheduling and resource allocations.
Note: You must set up colours for Job Types, Job Statuses, and Job Categories before using the Job Overview tab.

Job Filters
The job filters available on the Search tab are also available on the Job Overview tab. In addition to these filters, you can also search jobs by date by selecting options under Date Search.
You can hide the job filters to provide more room for the Job Overview
chart by clicking the ![]() button.
button.
Job Overview Chart
The lower section of the Job Overview tab contains two areas:
-
An expanding list of all jobs and projects matching the filtering criteria is displayed on the left. Click the plus or minus boxes next to a job or project to expand or collapse the jobs underneath it. All projects are displayed first, with jobs that are not assigned to a project displayed underneath them.
-
A Gantt chart showing all jobs and projects that match the filtering criteria is displayed on the right.
Projects are represented on the Gantt chart with arrowed bars ( ![]() ).
).
Jobs are represented as coloured bars. Select a value from the Colour Scheme control to determine what the colours will be used to represent - in addition to displaying jobs according to the colours set up for their Job Type, Job Status, and Job Category, you can also highlight jobs that have alerts or any custom flags enabled.
Where appropriate, resource allocations are displayed next to job bars.
Note: The chart does not update automatically as job details are changed. To update the chart, you must click Search again. If the Show Job Overview screen needs refresh warning User profile setting is enabled, a warning message alerts you when a job has changed. To set the chart to update itself at a set interval, configure the Job Cost Management Screen Auto Refresh Interval Company profile setting.
Navigating the Chart
Use the arrow buttons on the bar at the top of the chart to scroll it left and right
To change the zoom level of the chart, click the ![]() and
and ![]() buttons on the toolbar, or drag
the bar at the top of the chart left (zoom in) or right (zoom out).
buttons on the toolbar, or drag
the bar at the top of the chart left (zoom in) or right (zoom out).
Click the ![]() button to center
the chart on the currently selected job/project, and expand it to fill
the width of the display.
button to center
the chart on the currently selected job/project, and expand it to fill
the width of the display.
Click the ![]() button to print
a copy of the Gantt chart as it currently appears onscreen.
button to print
a copy of the Gantt chart as it currently appears onscreen.
Editing Jobs
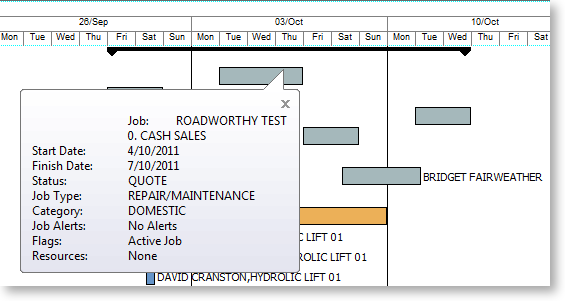
Hovering the mouse pointer over a project or job on the Gantt chart displays its details in a popup bubble:

Jobs can be dragged to change their dates:
- Click on the left edge of a job bar and drag to change the job's Start Date
- Click on the right edge of a job bar and drag to change the job's Due Date
- Click on the center of a job bar and drag to move the Start and Due Dates at once (keeping the job's duration the same)
Note: If resources have been allocated to a job, changing the Start and/or Due Date changes the resource allocation dates.
Double-clicking on a job opens the Job Details window, where the job can be edited.
Double-clicking on a project opens the Project Details window, where the project can be edited.
Right-Click Options
Right-clicking on a job or project on the Job Overview tab gives access to the following options:
- New Job - create a new job
- New Sub Job - create a new sub job
- New Duplicate Job - create a new job by copying an existing job
- Attach to Master Job - assign an existing job as a sub-job of an existing master job
- Add to Project - add the selected job to a project (and optionally create a new project)
- Remove from Project - removed the selected job from the project it is currently assigned to
- Edit Project Details - edit the details of the selected project
- Assign Resources - edit the resource allocations for the selected job


