- Contents
- Index
- Search

Display results with all search words
Adding a CrossTab to a Report
Before adding a CrossTab to a report, you must set up a suitable data source for it on the Data tab.
Note: When setting up a data source for a CrossTab, you should be careful to filter out unnecessary transactions. On a large database, calculating a CrossTab could take a long time, and it could affect performance if you are running it on the database server. It may be a good idea to perform some small test runs first to analyse the performance of the data query.
To add a CrossTab to a report, go to the Design tab and click the CrossTab
button (  ) on the Advanced
Components toolbar. Click on the main report canvas to add the CrossTab
component at that position.
) on the Advanced
Components toolbar. Click on the main report canvas to add the CrossTab
component at that position.
To edit the CrossTab, first use the Edit toolbar to select a data source for the CrossTab, then right-click on the CrossTab component and select Configure. The Configure Crosstab window appears:
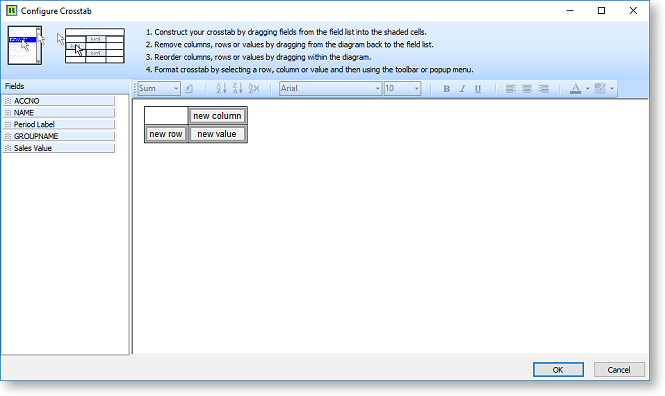
All fields from the CrossTab's data source are available on the left of the window. Drag fields onto the new column, new row and new value controls on the main area of the window to set up the data:
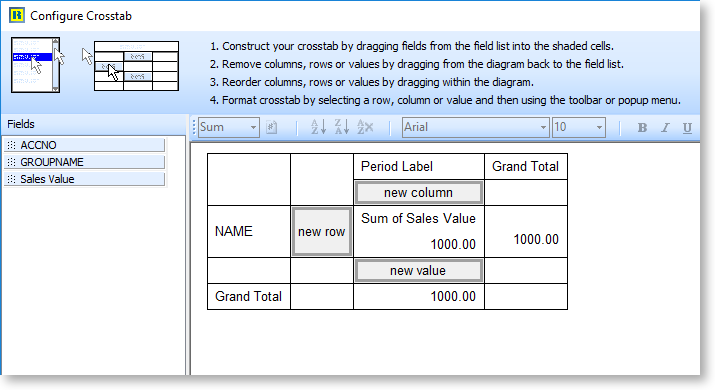
To remove a field from the CrossTab, drag it from the main area back to the list on the left.
You can add multiple rows, columns and values to the CrossTab and reorder them by dragging them into different positions - by experimenting with different data layouts, you can see how powerful and flexible the CrossTab representation can be.
Note: When a field is dragged onto a row or column, it is removed from the list on the left; however when a field is dragged onto a value, it remains in the list. This means you can add the same field as a value more than once, for example if you want to show the same value summed and also averaged.
Once you have the data fields in place, you can use the toolbar buttons and right-click options on the Configure Crosstab window to set up the CrossTab's appearance and behaviour.
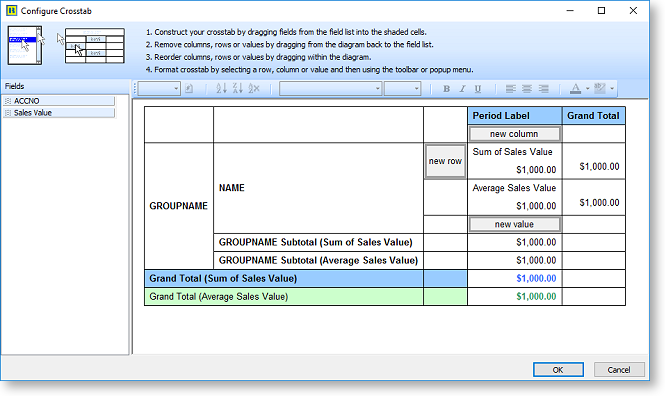
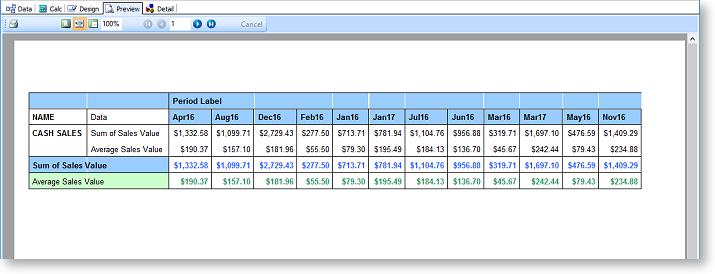
When you have finished configuring the CrossTab, click OK to return to the main report. You can now see how the CrossTab will look on the Preview tab:
CrossTab Toolbar Buttons

The tools on the Configure Crosstab window's toolbar let you change the behaviour appearance of the rows, columns and value elements on the CrossTab.
|
Button |
Name |
Description |
|
|
Calc Type |
This tool is available when the title of a value element is selected, e.g. "Sum of Sales Value" in the example above. It allows you to select the calculation that will be performed on the value, which can be one of:
Selecting a new calculation updates the value's title, e.g. if "Average" is selected, the title will becomes "Average of Sales Value". |
|
|
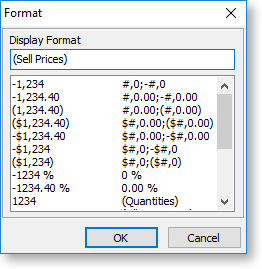
Display Format |
Opens a window where you can select how the data should be displayed. The available options depend on the type of data, e.g. for currency data, there will be options for currency formats, for date/time data, there will be options for date formats, etc.
|
|
|
Sort
Asc |
These tools are available when a row or column element is selected. They determine how the data in the row/column will be sorted: in ascending order, in descending order, or no sorting, i.e. the data will displayed in the order it appears in the data source. |
|
|
Font |
Select the font face for the selected element. |
|
|
Font Size |
Select the font size for the selected element. |
|
|
Bold |
Sets all text in an element to bold. |
|
|
Italic |
Sets all text in an element to italic. |
|
|
Underline |
Sets all text in an element to underline. |
|
|
Left Justify |
Aligns text to the left side of the element's bounding box. |
|
|
Center |
Aligns text to the right side of the element's bounding box. |
|
|
Right Justify |
Centers text relative to the element's bounding box. |
|
|
Font Colour |
Sets the colour of a element's text. |
|
|
Highlight Colour |
Sets the background colour that will appear behind the element's text. |


Right-click Options
You can right-click anywhere on the main area of the CrossTab to access the following options, which apply to the currently selected element of the CrossTab. Some options are only available for some elements.
|
Option |
Description |
|
Tips |
Turns the tips at the top of Configure Crosstab window on or off. |
|
Font |
Opens a window where you can set the font face, size, style and colour for the selected element. |
|
Colour |
Opens a colour picker window where you can set the background colour of the selected element. |
|
Display Format |
Opens a window where you can select how the data should be displayed. The available options depend on the type of data, e.g. for currency data, there will be options for currency formats, for date/time data, there will be options for date formats, etc. |
|
Skip Nulls |
Select whether or not to display null values for the selected element. |
|
Null Order |
If Skip Nulls is off, select whether null values should appear first or last in the data. |
|
Visible |
Select whether or not to display the element when the CrossTab is generated on the main report. |
|
Gridlines |
Select whether or not to display gridlines when the CrossTab is generated on the main report. |
CrossTab Settings on the Report
Options that affect how the CrossTab appears when the main report is generated are available from the right-click menu on the Design tab.
Right-click on a CrossTab component and select Pagination to control the order in which the pages print when the Crosstab cannot fit on a single page: Across then Down or Down then Across.
Right-click on a CrossTab component and select Style to choose how report captions (row or column headings) should appear when the Cross Tab cannot fit on a single page:
- Standard: Captions appear on the first page only.
- Repeated Captions: Captions appear on every page.