
Example: Designing an Analytical Report
The Analytical Report Manager (ARM) provides the functionality to produce accurate financial reports that can be customized according to your company's business needs.
MYOB Acumatica comes with a number of predefined Analytical reports, such as Balance sheet, Balance Sheet Comparative, Profit and Loss, Profit and Loss by Product, and Statement of Cash Flows.
Each analytical report consists of the following:
- a row set, which defines the rows to be used in the report.
- a column set, which defines the report title, column headers, and columns of the report.
- a report definition, which defines the report and links together the row set and a column set of a report and defines report parameters. The report definition is also used to easily add a report to the site map.
- a unit set, which defines units to be used for the report. With unit sets, the user can quickly filter or consolidate the report data. The use of unit sets is optional.
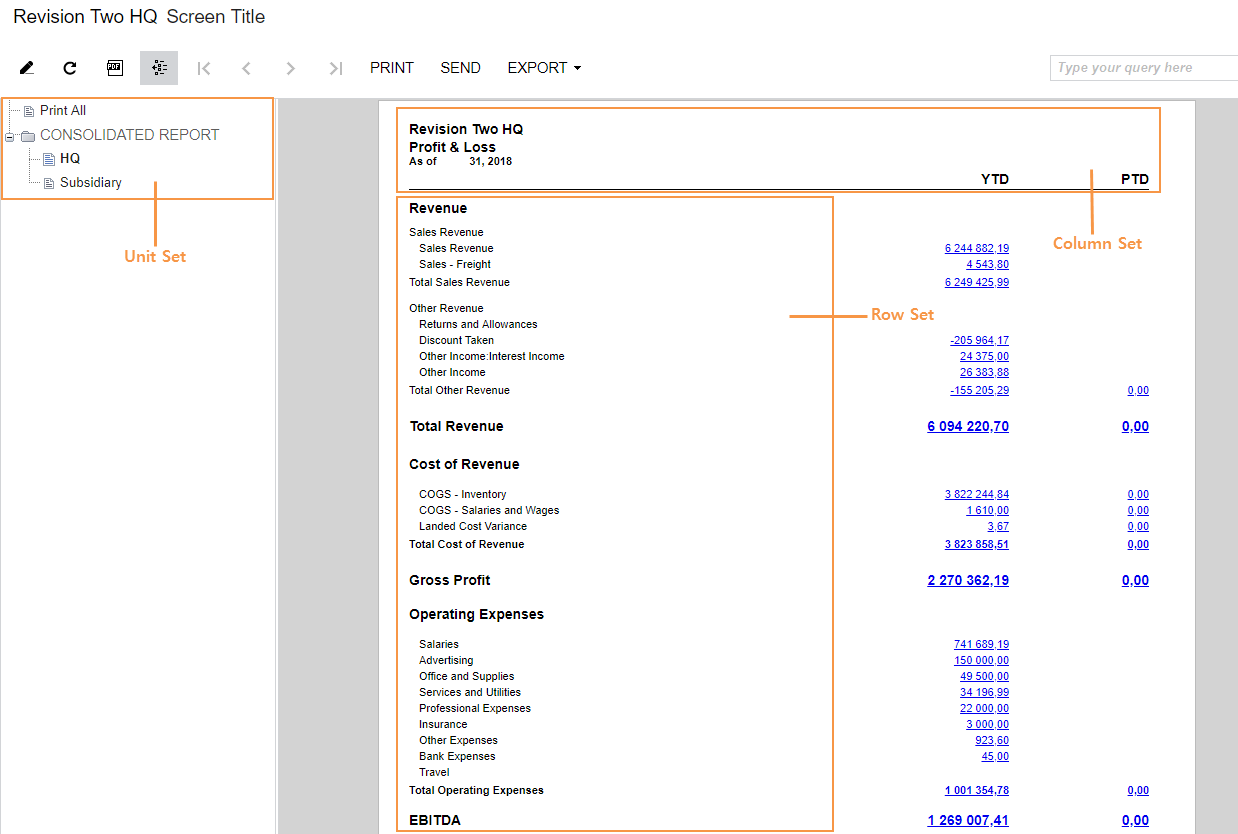
The report shown in the following screenshot will be examined as an example in this topic. You can perform the steps of this example or just read about them and become familiar with the report creation process. The purpose of this example is to provide the basic information to help you understand how the ARM works. This report consists of a row set, a column set, and a unit set, as you can see on the screenshot.
Creating a Sample Analytical Report
To create the report, do the following:- Open the Report Definitions (CS206000) form. This form is used to create reports, set up various report parameters, and select a row set, a column set, and a unit set to be used for the report.
- In the Code box of the Report Definition section, select DPL.
- On the form toolbar, click Copy Report. In the New Report Code dialog box, which appears, type SAMPLE DPL as the code, and click Copy. This closes the dialog box; you are now working with the copied version of the report with the SAMPLE DPL code, which is used to identify the report.
- In the Title box, change the value to Sample Profit
& Loss, and click Save on the form toolbar. Now
the SAMPLE DPL report will be available to access on the site map and through
standard search functionality of the UI. To find the report, you can simply type
Sample Profit & Lossin the Search box.The report you have just created uses a predefined row set, column set, and unit set; however, more experienced users may want to create their own sets from scratch or modify existing ones. Keep in mind that the row sets and column sets that you are working with can be used in other reports, so any modifications to existing sets may affect other reports. You can create new sets while using existing predefined sets as templates, so that making any changes to them affects only your report.
Previewing the Analytical Report
When the report has the required settings selected, you can preview it by doing the following:
- On the Report Definitions (CS206000) form, select the needed report code in the Code box.
- Click Preview on the form toolbar.
- In the tab that opens, review the generated report and see if the changes you have made suit your needs.
Creating a New Row Set
You use row sets to define the rows and row headers of the report.
The sample report is now configured with the same row set that is used by the predefined DPL - Profit and Loss analytical report. You can use the Report Definitions (CS206000) form not only to select the row set to be used in the report, but also to review and quickly modify the specified row set or even create a new one. To modify row set, do the following:
- On the Report Definitions (CS206000) form for the report you
have created (with the SAMPLE DPL code), click the Edit
button, which is right of the Row Set box.
This opens the Row Sets (CS206010) form in a new browser tab with the row set selected. You can use this form to modify the row set or to copy one and create a new row set.
- On the form toolbar, click Copy Row Set. In the New
Row Set Code dialog box, which appears, type SAMPLE
DPL as the code, and click Copy. This closes the
dialog box; the system returns you to the Row Sets
form with the copied version of the row set, which has the SAMPLE DPL code.
In this example, you will enhance the report with a Warehouse Assets section. To do this, you need to add two more rows to the SAMPLE DPL row set.
- On the table toolbar click Add Row. The row is added to the end of the list.
- In the respective columns of the newly added row, specify the following settings:
- Code: Type 0048. This value will be used by the ARM to specify the position of the row in the list.
- Description: Type Warehouse Assets. This text will be displayed as the row header.
- Type: Select Caption. This value indicates the type of the row.
- Style: Select Bold, Font Size 14.
- On the table toolbar, click Add Row.
- In the respective columns of the newly added row, specify the following settings:
- Code: Type 0049. This value indicates the position of the row in the list. With this code specified, the row will be displayed after the row that has the 0048 code.
- Type: Select GL. The GL type gives you the ability to use actual ledger data.
- In the Data Source box, click the magnifier icon, and in the
dialog box that opens, select the following values: Expand:
Select Account; Row Description: Select
Description-Code; Account Class: Select
WAREHOUSE.
With these settings, the expanded row will be displayed in the report, showing warehouse assets with each account in a separate line with a short description and a code.
- Click Save on the form toolbar.
- Go back to the browser tab with the Report Definitions form with the SAMPLE DPL code selected, and enter SAMPLE DPL in the Row Sets box.
- Click Save on the form toolbar.
- Preview the report to verify that the new rows with warehouse assets are displayed properly.
For more information about row sets in the Analytical Report Manager, see Row Sets.
Creating a New Column Set
Column sets give you the convenience to work with various types of information, such as date ranges or financial periods. Column sets can have columns with calculated values.
The sample report is now set up with the same column set as that used by the predefined Profit & Loss analytical report. You can use the Report Definitions (CS206000) form not only to select the column set to be used in the report, but also to review and quickly modify the column set or even create a new one. To modify the column set, do the following:
- On the Report Definitions form for the report you have
created (with the SAMPLE DPL code), click the Edit button to
the right of the Column Set box.
The system opens the Column Sets (CS206020) form in a new browser tab with the column set selected. You can use this form to modify a column set or to copy one and create a new column set.
- On the form toolbar, click Copy Column Set. In the New
Column Set Code dialog box, which appears, type SAMPLE
DPL as the code, and click Copy. This closes the
dialog box; the system returns you to the the Column Sets form with the copied version of the column set, which has the SAMPLE DPL
code.
In this example, you will enhance the report with a column displaying the beginning balance of the selected ledger. To do this, you need to add a column in the lower table of the SAMPLE DPL column set.
- On the table toolbar of the lower table, click New. This will add column D to the upper and lower tables.
- Use the upper table to set up the header for the new column. To do this, in the upper table, in the fourth row of the new column D, type ='Beginning Balance'
- Copy the style of the C column by clicking the fourth row of the C column and clicking Copy Style on the table toolbar. Then select the fourth row of the D column and click Paste Style on the table toolbar.
- Similarly, as described in the previous step, copy and paste the style of the fifth row of the C column to the fifth row of the D column.
- In the lower table, select the following settings for the D
column:
- Type: Select GL.
- Format: Type #,##0.00.
- Data Source: Click the magnifier icon, and in the dialog box that opens, select Beg. Balance in the Amount Type box.
- Click Save on the form toolbar.
- Go back to the browser tab with the Report Definitions form with the SAMPLE DPL code selected, and select SAMPLE DPL in the Column Sets box.
- Click Save on the form toolbar.
- Preview the report to verify that the new column with the beginning balance is displayed
properly.
For more information about column sets in the Analytical Report Manager, see Column Sets..
Reviewing Unit Sets
You can use unit sets to aggregate report data, so that multiple reports can be broken down and consolidated.
The sample report is now set up with the same Unit Set as that of the predefined Profit & Loss analytical report. You can use the Report Definitions (CS206000) form not only to select the Unit Set to be used in the report, but also to review and quickly modify the Unit Set or even create a new one. To modify column set, do the following:
- On the Report Definitions (CS206000) form for the report you have created (with the SAMPLE DPL code), select PRODUCT in the Unit Set box.
- Click Save on the form toolbar.
The selected unit set will be used for the report, which means that you can quickly filter or consolidate the report data by the product groups set up on the Unit Sets (CS206030) form.
- Preview the report to verify that the selected unit set grouping entries by product groups are displayed properly.
For more information about unit sets in the Analytical Report Manager, see Unit Sets.