Tabular Reports: To Create a Tabular Report
In the following activity, you will learn how to create a tabular report.
Story
Suppose that you are a technical specialist in your company who is working on simple customizations. A sales manager has requested a report that shows the quantity of inventory items ordered by customers. You have looked through the reports in the Sales Orders workspace and suggested that the manager use the Sales Order Details by Customer (SO611000) report. The sales manager said that the requested report should give salespeople the ability to compare the quantities of inventory items for different customers—that is, to display the quantities of an inventory item for different customers in the same row, with a separate row for each inventory item.
Process Overview
In the Report Designer, you will open the SO6110C1.RPX report, which is a copy of the Sales Order Details by Customer (SO611000) report, and modify the copy to make the report a tabular one. You will change the grouping conditions for the data in the report, and delete the groups and text boxes that you do not need from the report layout. (You will not make any modifications in the Schema Builder.)
System Preparation
Before you perform the steps of this activity, make sure that the following tasks have been performed:
- You have installed the MYOB Acumatica Report Designer, as described in Report Designer: To Install the MYOB Acumatica Report Designer.
- You have installed an MYOB Acumatica instance with the U100 dataset, or a system administrator has performed this task for you.
- You have signed in to MYOB Acumatica as the system administrator by using the gibbs username and the
123 password.Tip:The gibbs user is assigned the Administrator role and the Report Designer role. Thus, this user has sufficient access rights to manage system configuration and to preview, save, and publish reports.
Also, to prepare for use the file that is intended for this activity, do the following:
- Download the SO6110C1.rpx file.
- Open the downloaded file in the Report Designer.
- On the Report Designer menu bar, select , which opens the Save Report on Server dialog box.
- In the dialog box, specify the connection string and sign-in credentials of your
MYOB Acumatica instance, type SO6110C1 as the report name, and click
OK.
The report is saved on the server.
Step 1: Changing the Grouping Conditions for the Report
Because the data in the report should display the quantities of inventory items for different customers, you need to group data in the report by inventory item and by customer. That is, you need to change the grouping conditions for the report.
Do the following:
- In the Report Designer, make sure that the SO6110C1 report (which you have saved to the server) is open.
- In the top left corner of the Design pane of the Report Designer, click the
icon to select the report; then in the property, click the More button.
- In the Group Collection Editor, which opens, in the
Members pane, select
group1. - In the group1 properties pane on the right side of the Group Collection Editor, in the property, click the More button.
- In the GroupExp Collection Editor, which opens, in the Members pane, select the second PX.Reports.GroupExp member. For this member, in the right pane, the property is set to BAccount.AcctName. Click Remove to delete this member.
- Click OK to close the GroupExp Collection Editor.
- In the Group Collection Editor, in the Members pane,
select
group2. - In the group2 properties pane on the right side of the Group Collection Editor, in the property, click the More button.
- In the GroupExp Collection Editor, which opens, on the right pane, for the property, type SOLine.InventoryID.
- Click OK to close the GroupExp Collection Editor.
- Click OK to close the Group Collection Editor.
- On the Report Designer window toolbar, click Save.
Step 2: Modifying the Report Layout
To modify the report layout, while you are still working with the SO6110C1 report in the Report Designer, do the following:
- Select the
pageHeaderSection2section, and in the context menu, click Delete to delete this section. - In
groupHeaderSection1 (Header of group1), delete the text box with the=[BAccount.AcctName]value and all the text boxes to the right of this text box. - Move the text box with the
=[BAccount.AcctCD]value to the right. - From the Tools pane, drag the TextBox element to the left side of the
groupHeaderSection1 (Header of group1)section, and type Inventory Item for the property of the added text box. - Select the
groupHeaderSection3 (Header of group1)section, and in the context menu, click Delete to delete this section. - Select
groupHeaderSection2 (Header of
                        group2)
, and for its property, set the True value to make the content of the section visible. - In
groupDetails, select the text box with the=[SOLine.InventoryID]value, copy it, and paste it on the left side of thegroupHeaderSection2 (Header of group2)section below the text box with theInventory Itemvalue ingroupHeaderSection1 (Header of group1). - In
groupFooterSection2 (Footer of group2), select the text box with the=Sum(isnull([SOLine.OrderQty]*-[SOLine.InvtMult],0))value, copy it, and paste it togroupHeaderSection2 (Header of group2), below the text box with the=[BAccount.AcctCD]value ingroupHeaderSection1 (Header of group1). - On the left side of
groupFooterSection1 (Footer of group1), add a text box with the Total: value.Tip:You can set the value of the property of this section to20px. - In
groupFooterSection2 (Footer of group2), select the text box with the=Sum(isnull([SOLine.OrderQty]*-[SOLine.InvtMult],0))value, and copy and paste it togroupFooterSection1 (Footer of group1), to the right of the text box with theTotal:value. - In
groupFooterSection2 (Footer of group2), delete all the elements. - In
groupDetails, delete all the elements. - Reduce the height of
groupDetails,groupFooterSection2 (Footer of group2), andgroupFooterSection3 (Footer of group2)as much as you can.Tip:You can set the value of the property of these sections to0px. - Optional: To improve the readability of the report, place four horizontal line
elements in the following positions:
- In
groupHeaderSection1 (Header of group1), below the text box with theInventory Itemvalue - In
groupHeaderSection1 (Header of group1), below the text box with the=[BAccount.AcctCD]value - In
groupHeaderSection2 (Header of group2), below the text box with the=[SOLine.InventoryID]value - In
groupHeaderSection2 (Header of group2), below the text box with the=Sum(isnull([SOLine.OrderQty]*-[SOLine.InvtMult],0))value
- In
- On the Report Designer window toolbar, click Save.
- View the report (by following instructions similar to those in Step 4:
Viewing the Report below) to make sure that you have modified the report
layout correctly. See the following screenshot for
reference.Tip:Viewing the report before you make it a tabular one will ease troubleshooting.
Figure 1. The modified Sales Order Details by Customer report 
Step 3: Specifying the Properties of the Report and Its Elements
To specify the properties of the report and its elements, while you are still working with the SO6110C1 report in the Report Designer, do the following:
- In the top left corner of the Design pane of the Report Designer, click the
icon to select the report. In the property, select True to make the report a tabular one.
- In the property, type
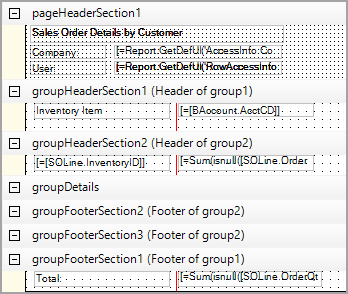
150px.A red vertical line is displayed in the report. To the right of the red line, the customers and the quantity of ordered items will be displayed in the generated report. Make sure that no element crosses the red line.
- Move the text box with the
=[BAccount.AcctCD]value (ingroupHeaderSection1 (Header of group1)) and the text box with the=Sum(isnull([SOLine.OrderQty]*-[SOLine.InvtMult],0))value (ingroupHeaderSection2 (Header of group2)) so that they are located next to the red line. Remove the horizontal lines that were located below these text boxes. - In the top left corner of the Design pane of the Report Designer, click the
icon to select the report. In the property, type
320px. - For a uniform alignment of elements in the report, in
groupHeaderSection2 (Header of group2), select the text box with the=Sum(isnull([SOLine.OrderQty]*-[SOLine.InvtMult],0))value, and for its property, select NotSet. Repeat the same action for the text box with the same value in thegroupFooterSection1 (Footer of group1)section. - On the Report Designer window toolbar, click Save.
The report in design mode is shown in the following screenshot.

Step 4: Viewing the Report
To view the report, do the following:
- In MYOB Acumatica, open the S150 Sales Order Details by Customer (SO6110C1) report form by
searching for its identifier.Tip:This report, which you have modified in this activity, has been published in the U100 dataset. That is, it has been added to the Site Map (SM200520) form, and you can access it in MYOB Acumatica.
- On the Report Parameters tab, select 11/1/2024 in the Start Date box, and select 1/28/2025 in the End Date box.
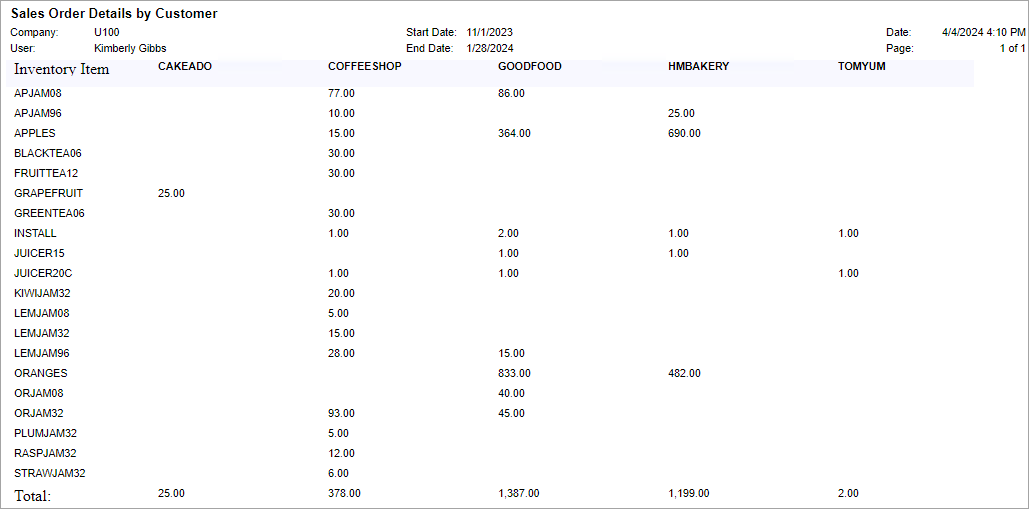
- On the report form toolbar, click Run Report.
Make sure that the report displays data for all customers and that the data about the quantity of orders for each customer is displayed in a separate column. (You can compare the lists of customers in the SO6110C1 and SO611000 reports with the same name.) The resulting report is shown in the following screenshot.

