
Step 2: Preparing the Project for Debugging
To find the workflow event that you can use in a customization project, you can debug
the MYOB Acumatica source code with breakpoints and see which breakpoint is hit in which scenario.
In this step, you will prepare the PhoneRepairShop_Code for debugging in Visual Studio.
To prepare the PhoneRepairShop_Code project for the debugging of the MYOB Acumatica code, you should do the following:
- Make sure the MYOB program database (PDB) files are located in the Bin folder of the MYOB Acumatica instance folder that you are using for this activity.
The PDB files were copied to the Files\Bin folder of the MYOB Acumatica installation folder (such as C:\Program Files\Acumatica ERP\Files\Bin) during the installation process if the Install Debugger Tools check box was selected in the MYOB Acumatica Installation wizard. When you create a new instance or update an existing one, these PDB files are copied to the Bin folder of the instance. If you did not select the Install Debugger Tools check box during installation, you should remove MYOB Acumatica and install it again with the Install Debugger Tools check box selected. For details, see MYOB Acumatica Installation On-Premises: To Install the MYOB Acumatica Tools (Optional).
Tip:A PDB file holds debugging and project state information that is used for incremental linking of a debug configuration of your program. In general, a PDB file contains the link between compiler instructions and lines in source code. - Configure the Web.config file of the instance by doing the following:
- In the file system, open in the text editor the Web.config file, which is located in the root folder of the PhoneRepairShop instance.
- In the
<system.web>tag of the file, locate the<compilation>element. - Set the debug attribute of the element to True, as shown in the following code.
<system.web> <compilation debug="True" ...> - Save your changes.
- Configure the
PhoneRepairShop_Codeproject for debugging by doing the following:- In Visual Studio, open the
PhoneRepairShop_Codesolution, which includes both thePhoneRepairShop_Codeproject and the website. - On the main menu, select .
- In the section, clear the Enable Just My Code check box, as shown in the following screenshot.
Figure 1. The cleared Enable Just My Code check box 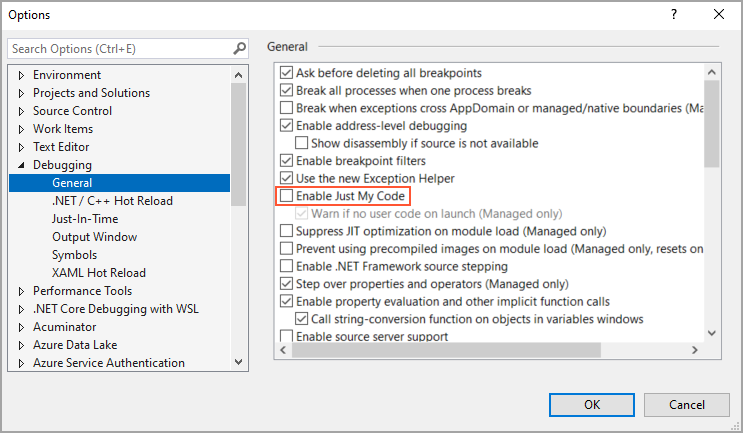
- In the section, in the Symbols file (.pdb) locations list, add the path to the location of the PDB files in your MYOB Acumatica instance.
- Click OK.
- In Visual Studio, open the
- To view the source code of the
Releaseaction of the Payments and Applications (AR302000) form, open thePX.Objects.AR.ARPaymentEntrygraph: In the website folder in the Solution Explorer, select , and go to the definition of the Release action—that is, theIEnumerable Release(PXAdapter adapter)method. - Add a breakpoint inside the
Releasemethod, as shown in the following screenshot.Figure 2. The source code of the Release action 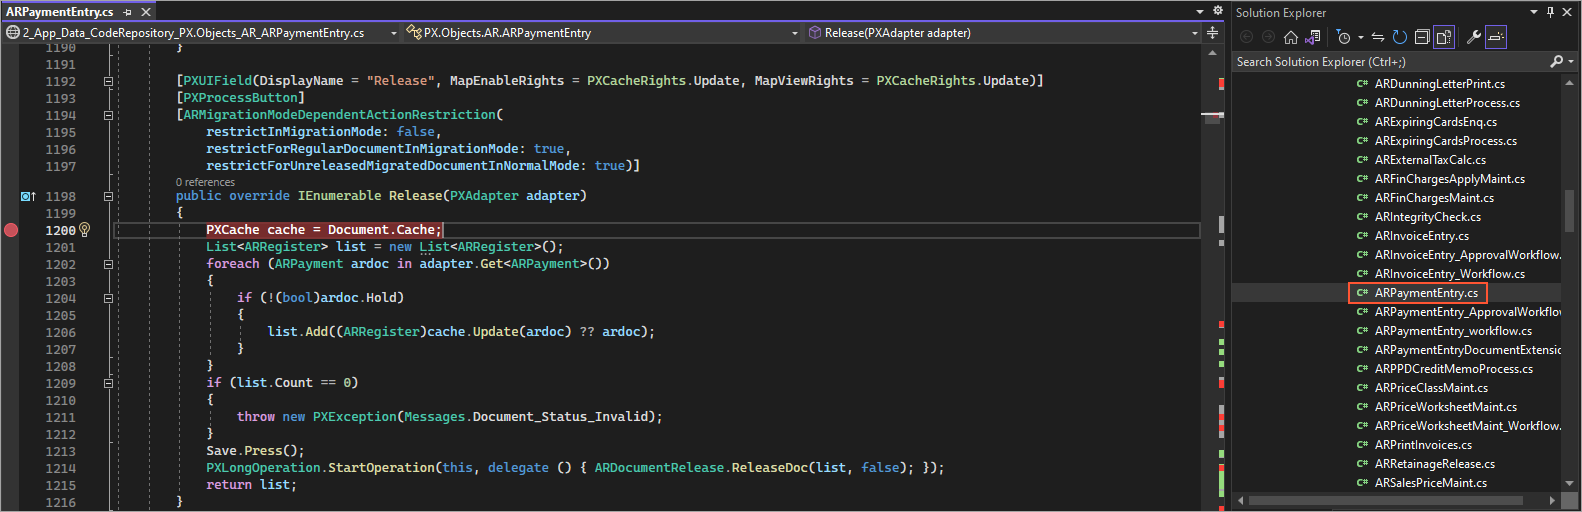
- Attach the Visual Studio debugger to the w3wp.exe running process. Tip:For details about attaching to the process, see To Debug the Customization Code.
- Start debugging by doing the following:
- In MYOB Acumatica, open the Payments and Applications (AR302000) form.
- Create a payment.
- On the form toolbar, click the Release button.
Wait until the breakpoint is hit.
- In Visual Studio, view the debug information for the
Releasemethod.