- Contents
- Index
- Search

Display results with all search words
Chart Properties
After you have set up a data series for a chart, you can edit the chart's other properties. Chart properties are divided into sections, which appear in the tree on the left of the window:
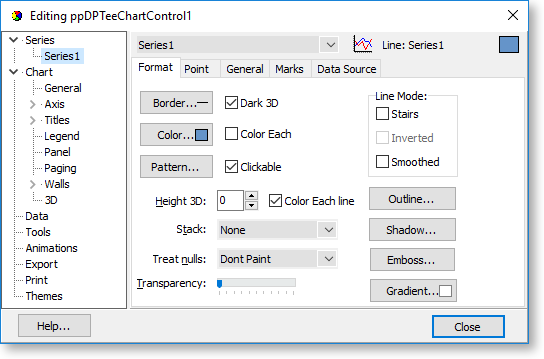
Note: The property pages that appear on the right of the window as you click items in the tree layout will dynamically re-organise depending on what you've selected. For example, if you select the "Chart" node, you'll see tabs for General, Axis, Titles and so on, with all their respective property pages underneath each one. If you select "Axis", you'll only see the property pages under Axis, and so on.
General
This section contains options to allow scrolling or zooming on interactive charts (in preview mode or on the Dashboard) and set fonts for each of the text fields that make up the chart.
To turn zooming on or off, tick or clear the Allow option on the Zoom sub-tab.
To configure scrolling, select an option under Allow Scroll on the Scroll sub-tab.
Axis
This section contains options that affect the chart's six axes (Left, Right, Top, Bottom and two Depth axes for 3D charts). For each axis, you can set its scales, min/max values, ticks, labels, position and so on. Notable axis properties include:
- The Inverted option on the Options sub-tab can be ticked to invert the axis and all property point along it.
- The properties on the Minimum, Maximum and Inverted sub-tabs let you change the automatic min/max and increment calculations, which will force the chart to use the values you select.
- The Title sub-tab lets you set and format the titles for each axis.
Titles
This section lets you set and format for the chart's title, sub-title, sub-footer and footer text.
Legend
This section lets you determine whether or not to display a legend on the chart, and to format the legend if one is displayed.
To turn the legend on or off, tick or clear the Visible option on the Style sub-tab.
Panel
This section lets you set up the background of the chart, which can contain a solid colour, a gradient or an image.
Paging
This section controls multi-page charts, which are not common in Exo Clarity reports.
Walls
This section lets you set up the chart's walls, which are the planes that makes up the sides of a 3D chart. In the default 3D chart, there are three visible walls: the X axis wall, the Y axis wall, and the back wall. If you add a right axis then another wall will be created for that axis. Walls help give 3D charts their depth, but 2D charts also use the back wall.
3D
If you are using a 3D chart, this section contains settings that let you change its 3D properties including zoom, rotation, elevation and perspective.
Data
For charts that are not bound to a data source, this section displays the data that has been entered for the chart. You can edit the data here or on the Data Source tab of the Series section.
Tools
This section lets you add advanced reporting tools to the chart.
Animations
This section lets you add animations to the chart.
Export
For charts that are not bound to a data source, this section lets you export data directly from the chart editing window. You can export the chart as a bitmap image, a .WMF metafile or an .EMF enhanced metafile.
For charts that are not bound to a data source, this section lets you print the chart directly from the chart editing window.
Themes
This section lets you set a visual theme for the chart.