- Contents
- Index
- Search

Show results that include all search words
Exo Business Analytics
Exo Business Analytics presents a customisable overview of the organization’s business status. Management can use it monitor business performance.
Exo Business Analytics extracts data from various sources in Exo Business and then displays it in a consolidated format.
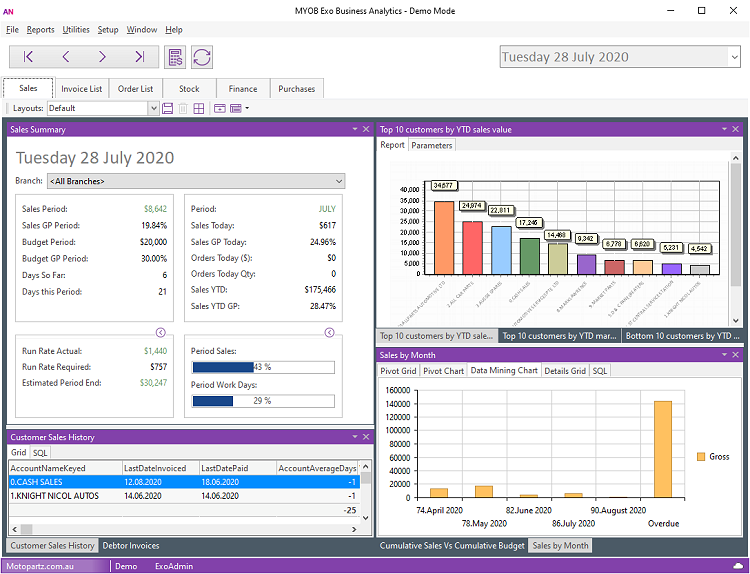
Exo Business Analytics takes data snapshots at regular intervals. Use the arrow buttons to navigate between snapshots, or select a snapshot from the dropdown menu on the right.
Click the ![]() button on any tab to re-calculate the figures for the currently selected
snapshot.
button on any tab to re-calculate the figures for the currently selected
snapshot.
Click the ![]() button on any
tab to refresh the display.
button on any
tab to refresh the display.
Note: You can use the computer-level profile settings Recalculate and Refresh Analytics on Startup and Recalculate and Refresh Analytics every 15 mins when loaded to automate the process of taking and refreshing data snapshots.
Each tab displays a collection of Dashboard widgets.
Note: You can hide tabs for individual users by configuring the Hide tabs in EXO Analytics User-level profile setting.
Note: You can define two custom tabs by specifying values for the Analytics custom tab 1 caption and Analytics custom tab 2 caption User-level profile settings. If you don't add a caption, the custom tabs don't display.
You can drill down to theese screens:
-
Debtor Account Details screen
-
Creditor Account Details screen
-
General Ledger Account Details screen
-
Stock Item screen
-
Sales Order
-
Purchase Orders
-
Job Costing
All screens are read-only when accessed from Exo Business Analytics.
System Widgets
You can use these widgets:
Sales Summary
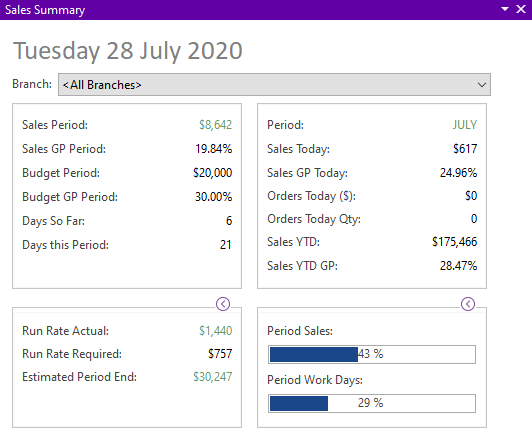
This widget displays the sales performance of the business. The Run Rate figures indicates what the business is doing on a daily basis (having made an allowance for the weighting applied to each day in the Period Day Plan Setup) and what the business must achieve (also on a weighted basis) to reach its period budget.
The report uses colour to indicate whether the business is ahead of (green) or behind (red) the budget.
Invoice List (Classic)
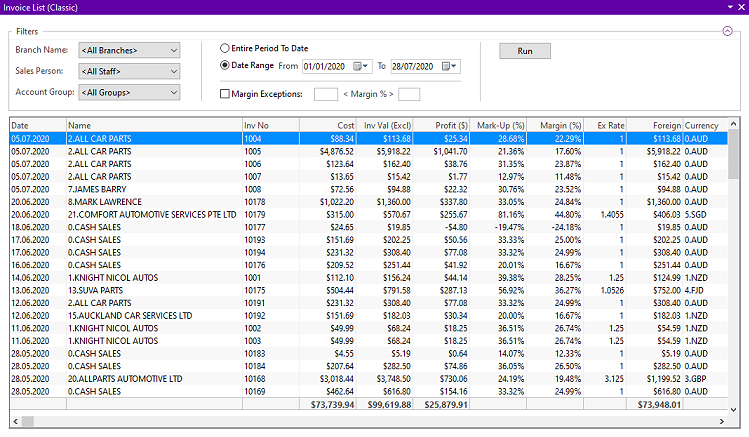
Use this widget to search for Debtors Invoices. For example, by setting the expected minimum and maximum margins, you can locate invoices that fall outside the expected range. This range can include stock items that are over-discounted or that have a cost that is greater than expected.
To search for invoices, select the filters to use, then select the details to filter by. Click the Run button to return all invoices that match the selected criteria.
Orders List (Classic)
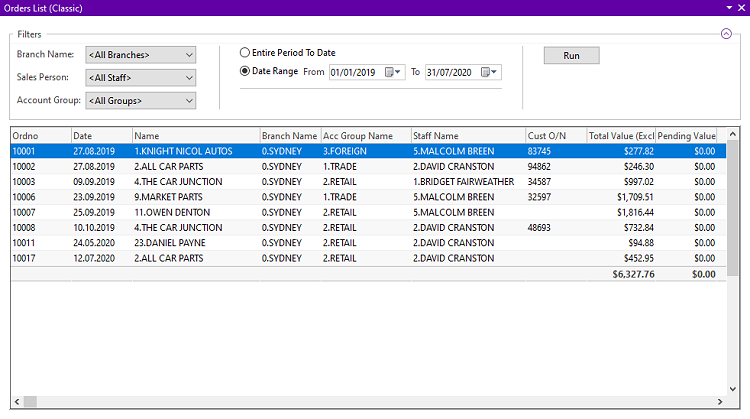
Use this widget to search for Sales Orders. You can filter the list of orders by Period, Account Group, Sales Person, and Branch Name.
Stock Summary
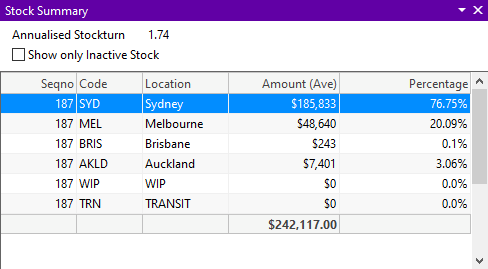
This widget displays the valuation of stock by location. You can select a location, and obtain a stock list by a stock item, for that location.
The Show only Inactive Stock option displays a list of stock items that are inactive. Stock items display only if the item quantity is greater than zero. You can drill down to view the locations of the inactive stock.
The Annualised Stock Turn KPI calculates the stock turn based on the current cost of sales on a period-to-date basis, using the current closing stock level. The KPI then converts this into an annualised estimate of current stock turn.