- Contents
- Index
- Search

Show results that include all search words
GL Graph
Use the graph to view the status of a series based on the selected criteria.
Viewing the GL Graph
Utilities > General Ledger Utilities > General Ledger Graphs
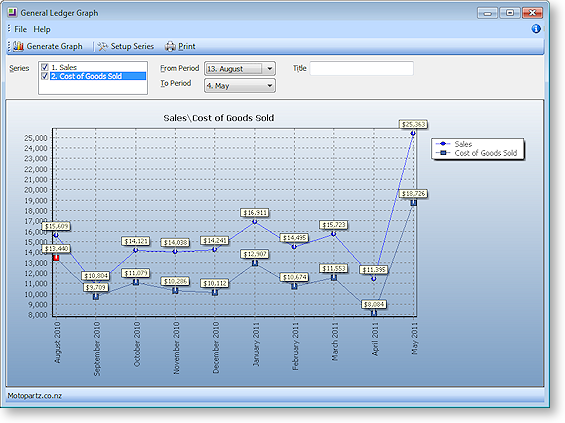
To view the graph:
-
Specify the criteria for the graph:
-
Select which series to display on the graph.
-
Specify start and end periods for the graph.
-
Enter a title for the graph.
-
-
Click the Generate Graph button.
-
Click the Print button to print the graph.
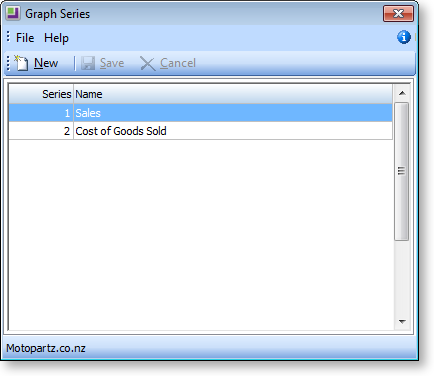
Setting Up Graph Series
To define additional series for the graph:
-
Click the Setup Series button on the General Ledger Graph window. The Graph Series window opens:
-
Click the New button.
-
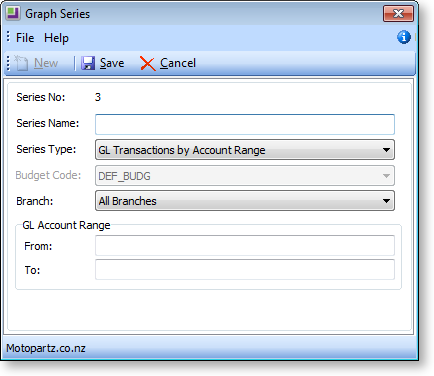
Enter a name for the series in the Series Name field.
-
Select the Series Type from the dropdown list. Depending on the type that you select, other options are enabled.
-
Select the Budget Code to which the series is to be restricted from the dropdown list.
-
Select the Branch from the dropdown list.
-
Specify the from and to GL Account Range as specified in the GL.
-
Click Save.