- Contents
- Index
- Search

Display results with all search words
Report Layout Tips
How do I dynamically resize a report?
Some reports need to resize dynamically, e.g. "Top X" dashboard reports need to resize so when you choose "Top 10" it only shows 10, and when you select "Top 50" it expands to show all 50. Without changing the page size dynamically, you'd need to have a fixed page that was as long as the longest that your report could possibly be; otherwise your data would flow onto second and subsequent pages (since you can't change pages in the Dashboard view, the data would be hidden from the user). Since having very long pages is not an ideal solution, page resizing is currently used on all the standard Dashboard reports.
In order to set the page size, you need to change a Printer Settings property of the report. In our case, we can set the page width and margins at design-time, and all we need to worry about at runtime is the page height. Here is an example:
Report.PrinterSetup.PaperHeight := nNewPageHeight;
Dynamic page height often depends on the number of records you have retrieved from the database, so the page resizing needs to occur after the detail bands have all been calculated. This becomes complicated, because resizing the page potentially alters the entire flow of all the sections of the report, it needs to happen before the final report has started generating. So it needs to be done in a four-step process:
-
Expand the report to be arbitrarily high in the Page Setup (say, 4000 pixels).
-
Allow the report to run through once - this should put all the Detail records on one page. (If we don't try to get them all on one page, often the records on the second and subsequent pages won't be calculated at all, since they are generated only when you move to page two.)
-
Count the number of detail lines and calculate how long the page should be - don't forget to take into account the top and bottom margins, all visible sections, all group headers and footers (one of each for each group), and all detail lines (one for each record in the primary data source). This is complicated by the fact that there's no way to calculate the actual printed height of sections that have dynamically adjusted height; you can only get the value of the height that was set in the design canvas. Try to avoid dynamic height sections (and stretching memo fields, etc.) for this reason.
-
Resize the page with the newly calculated height and refresh the report with the RefreshPage() procedure. This will redraw the report and re-query the database.
Here's the final piece of code that is used in many dashboard reports (not including the calculations are done to determine the page height):
Report.PrinterSetup.PaperHeight := nPageHeight
+ Report.PrinterSetup.MarginTop
+ Report.PrinterSetup.MarginBottom + 50;
You can find this in the "ResizePage" custom program of each report.
How do I force the Summary band to cover the whole of the last page of the report?
-
Enlarge the Summary section to be the size of your page.
-
Set the Header and Footer bands to be not visible if the page count has been reached:
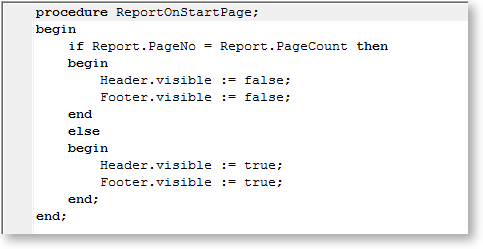
-
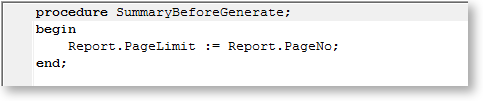
When the Summary band prints, set the page limit property to the current page:
How do I force the Group Footer to appear at the end of each page?
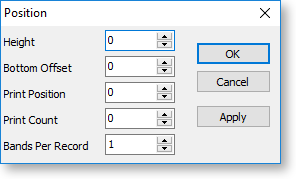
Right-click on your Group Footer band and choose Position. Set the PrintPosition property so that the band aligns itself to the bottom of the page - the more you increase the value, the further down the page the band moves.
Note: Remember that each group will show on a separate page. The default nature of the group footer is to appear at the end of each group. If the "Group Footer" is positioned at the bottom of the page, then each group will end at the bottom of a page. Therefore each group will occupy at least 1 full page.
How do I skip a group when a condition is met?
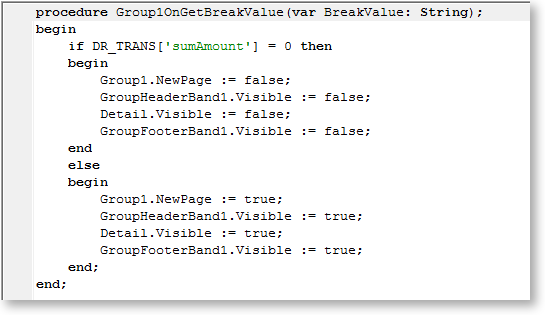
Add code to the group's OnGetBreakValue event to see if the condition is met and if so cancel new page and set the Group Header, Group Footer and Detail bands to not visible.
How do I count the number of records in each group at the end of the group?
Place a DBCalc component in the Group Footer band. Select the field for which you want to do the count from the Edit toolbar. Right-click on the component and select Calculations to open the Calculations window:
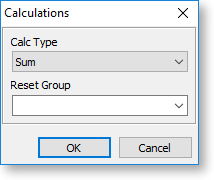
Select "Count" for the Calc Type. Placing this component in the Group Footer band will show the count of each group in the report. You can do the same to perform Sum and Average calculations.
Note: You can select a Reset Group on the Calculations window to set when the calculation is reset to zero.
How do I get a record count in the header rather than in the footer?
Set up a DBCalc component to calculate the record count and place it in the Header or Group Header band. Right-click on the component and enable the LookAhead option - this will pre-calculate the lines before displaying the value.
Note: This could delay the preview of complex or large reports while the value calculates.
How do I set the number of Detail lines per page?
Right-click on the Detail band and select Position. In the Print Count field, type the number of records you want to be displayed per page in your report.
How do I draw column lines in the Detail band?
-
Adjust the width of the detail band as required.
-
Add Line components to the Detail band everywhere you want a column line - for vertical lines, choose "Left" or "Right" from the dropdown in the Edit toolbar.
-
Resize each line manually to reach from the top of the to the bottom, or right-click on each line and select Parent Height.
To show an end line in each page of the report, add a horizontal Line component at the very top of the Footer band.
How do I set a watermark image or text in the background?
-
Add a background layer by right-clicking on Design Layers in the Report Tree and selecting New Page Layer. A tab for the new layer will appear at the bottom of the Report Tree - click this tab to edit the layer.
-
Place an Image component on the background layer. Right-click on the component and select Picture to choose the image file to display.
-
Right-click on the Image component and enable the Stretch and Maintain Aspect Ratio options, then re-size it as required. The picture will extend and spread along the whole page uniformly as the height increases.
-
Return to the foreground layer. Right-click on the other components on this layer and ensure that Transparent is selected for all of them - this removes any foreground colour on the fields, allowing the background image to be seen through them.
Note: It is a good idea to lighten the background image using an image editing program, otherwise it may make the report content hard to read.