- Contents
- Index
- Search

Show results that include all search words
GL Graph
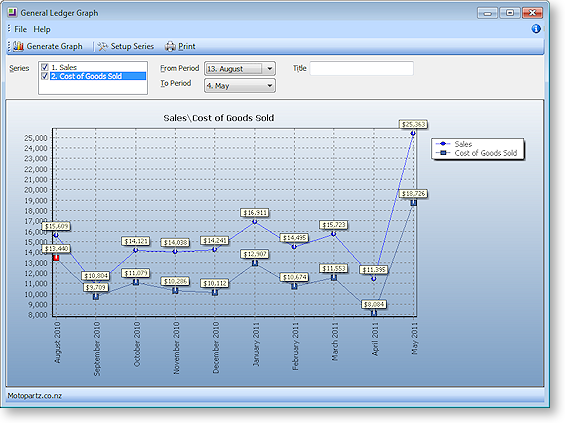
The graph allows you to view the status of a series based on the selected criteria.
Viewing the GL Graph
Utilities > General Ledger Utilities > General Ledger Graphs
-
Specify the criteria for the graph:
-
Select which series to display on the graph.
-
Specify start and end periods for the graph.
-
Enter a title for the graph.
-
-
Click the Generate Graph button to generate the graph. The resulting graph can be printed using the Print button.
Setting up Graph Series
You can define additional series for the graph if more are required:
-
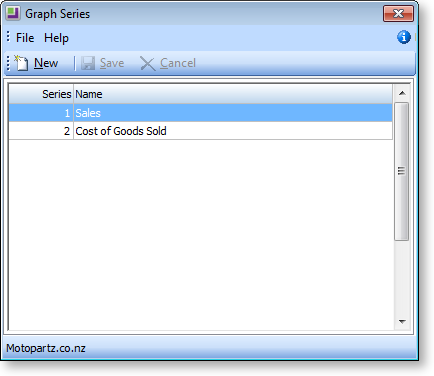
Click the Setup Series button on the General Ledger Graph window. The Graph Series window opens:
-
Click the New button.
-
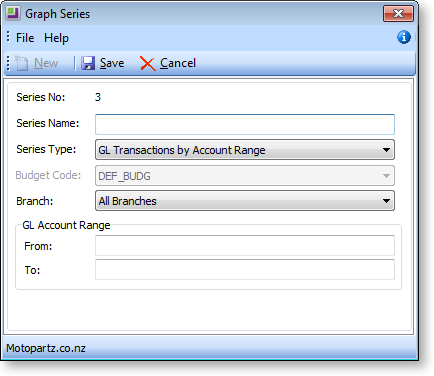
Enter a concise name for the series in the Series Name field.
-
Select the Series Type from the drop down list. Depending on the type selected, other options become available. These are defined in the next few steps, bear in mind that some of these will only be available according to the Series Type chosen.
-
Select the Budget Code to which the series is to be restricted from the drop down list.
-
Select the Branch from the drop down list.
-
Specify the from and to GL Account Range as specified in the GL.
-
Click Save to add this series to the list or Cancel to lose your edits and close this window.