- Contents
- Index
- Search

Show results that include all search words
What is a Dashboard?
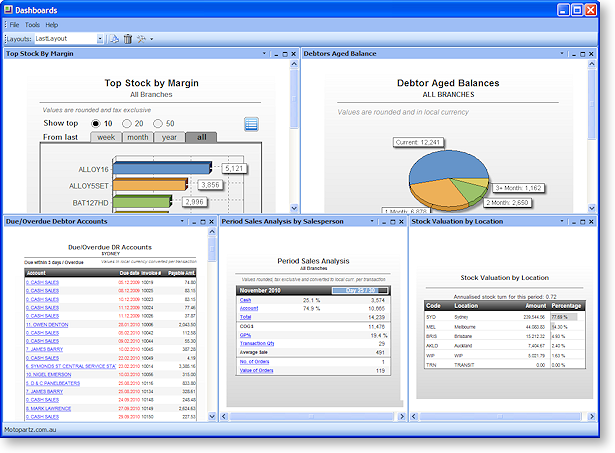
Dashboards are about conveying (often aggregated) information in a format that makes the data useful. It's mostly about showing current information rather than historical, although historical information can be used for comparison. It allows you to see multiple aspects of your business and compare data at a glance, by showing you a number of “views” - each view should have something useful to report.
It's not about a flashy view of data, it's about making facts and figures clearly accessible. It's about whittling down the masses of data available in your system and extracting trends and statistics that actually enable you to take action, save time and ultimately be more productive. In your Dashboard design, be careful to avoid reports that are difficult to interpret, present too much unnecessary detail, or duplicate existing reports without providing any added benefit.
Summary
Dashboards are customisable displays showing one or more "gadgets". In most cases these gadgets are summary reports, making the Dashboard an at-a-glance overview of the entire MYOB EXO Business system. Other functions can be added as gadgets however, including external applications.
Data on Dashboard reports can be printed or exported using the options on each gadget's toolbar.
Is it “Business Intelligence”?
There are many tools available on the market for analysing data, collectively known as Business Intelligence (BI) tools.
The Dashboard is not strictly a BI tool, but there are many BI tools available from 3rd parties that could be configured to work with MYOB EXO Business (basically anything that is MS SQL Server compatible). These allow you to slice and dice your data, report on it, drill up and down as much as you like, and you can pretty much track or compare anything in your database with relative ease.
Unfortunately, these tools usually require a huge amount of skilled setup, invariably at great cost, and with the amount of flexibility there can be information overload unless it is continually handled properly.
The Dashboard tool is not nearly as powerful as one of these tools (nor does it claim to be), but the benefits are that it is built into the MYOB EXO Business product, supported and updated by MYOB, and it uses the already-familiar Clarity Designer for implementing changes.
Note: MYOB EXO Business Dashboard views are not currently based on an OLAP (On-line Analytical Processing) backend, and are effectively just regular Clarity reports designed for showing aggregated data in a multi-port view. Because of this, if your Dashboard report queries are not designed properly they may take a long time to calculate, slowing down the system each time they refresh – particularly if you show multiple copies at once.